

Question: We continue the analysis begun in Exercise 1.7 by examining the relation between y = LIFEEXP and x = FERTILITY, shown in Figure 2.12. Fit
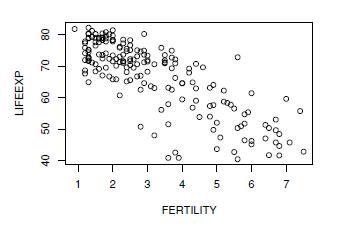
We continue the analysis begun in Exercise 1.7 by examining the relation between y = LIFEEXP and x = FERTILITY, shown in Figure 2.12. Fit a linear regression model of LIFEEXP using the explanatory variable x = FERTILITY.
a. The United States has a FERTILITY rate of 2.0. Determine the fitted life expectancy.
b. The island nation Dominica did not report a FERTILITY rate and thus was not included in the regression. Suppose that its FERTILITY rate is 2.0. Provide a 95% prediction interval for the life expectancy in Dominica.
c. China has a FERTILITY rate of 1.7 and a life expectancy of 72.5. Determine the residual under the model. How many multiples of s is this residual from zero?
d. Suppose that your prior hypothesis is that the FERTILITY slope is−6.0 and you wish to test the null hypothesis that the slope has increased (i.e., the slope is greater than −6.0). Test this hypothesis at the 5% level of significance. Also compute an approximate p-value.
LIFEEXP 40 50 60 70 80 ' 2 3 4 5 6 7 FERTILITY 00
Step by Step Solution
3.48 Rating (161 Votes )
There are 3 Steps involved in it
a Fitted US LIFEEXP 83738152735 times 20731911 b A 95 predi... View full answer

Get step-by-step solutions from verified subject matter experts