Using the data from Data Set IV in Appendix B, construct a frequency distribution and draw a
Question:
Using the data from Data Set IV in Appendix B, construct a frequency distribution and draw a histogram. Describe briefly the shape of the distribution of the tallest buildings in New York City.
Data from Set IV Appendix B
Transcribed Image Text:
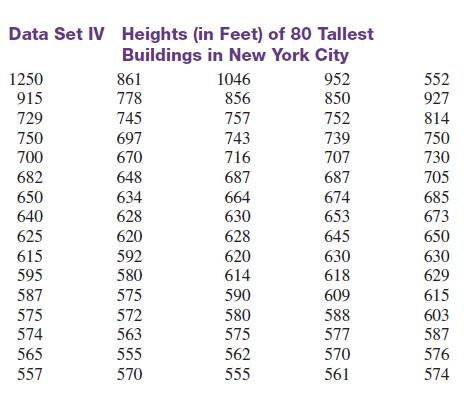
Data Set IV Heights (in Feet) of 80 Tallest Buildings in New York City 1250 915 729 750 700 682 650 640 625 615 595 587 575 574 565 557 861 778 745 697 670 648 634 628 620 592 580 575 572 563 555 570 1046 856 757 743 716 687 664 630 628 620 614 590 580 575 562 555 952 850 752 739 707 687 674 653 645 630 618 609 588 577 570 561 552 927 814 750 730 705 685 673 650 630 629 615 603 587 576 574
Fantastic news! We've Found the answer you've been seeking!
Step by Step Answer:
Answer rating: 71% (14 reviews)
To construct a frequency distribution we need to group the data into ...View the full answer
Answered By
Anik Kumar Bosu
I am expert in Maths, Physics, Chemistry and Biology. I also teach student from 3 years. Students becomes satisfied by my teaching. So, do not worry.
0.00
0 Reviews
10+ Question Solved
Related Book For
Elementary Statistics A Step By Step Approach
ISBN: 9780077665807
9th Edition
Authors: Allan G. Bluman
Question Posted:
Students also viewed these Statistics questions
-
Which of these comes closest in structure to that of a hierarchical database? a) Organization chart b) List of students and their classes c) List of specialty doctors and their patients d) A map of a...
-
Construct a frequency distribution and has the greatest relative frequency and which has the least relative frequency? relative frequency histogram for the data set using five classes. Which class...
-
Managing Scope Changes Case Study Scope changes on a project can occur regardless of how well the project is planned or executed. Scope changes can be the result of something that was omitted during...
-
1. Give 3 examples of well-defined sets. 2. Name two subsets of the set of whole numbers using both the listing method and the rule method. 3. Let B [1, 3, 5, 7, 9}. List all the possible subsets of...
-
Refer to Problem 12. Assume drat unusually mild weather has caused a change in the quantity and timing of orders for golf carts. The revised plan calls for 100 golf carts at the start of week 6, 100...
-
The velocity profile in laminar flow in a pipe is a parabolic function of \(r\) and can be represented as \[v_{z}=v_{\mathrm{c}}\left[1-(r / R)^{2} ight]\] The parameter \(v_{\mathrm{c}}\) appearing...
-
Use the data set, which represents the ages of 30 executives. Which ages are above the 25th percentile? 43 57 65 47 57 41 56 53 61 54 56 50 66 56 50 61 47 40 50 43 54 41 48 45 28 35 38 43 42 44
-
Scott Investors, Inc., is considering the purchase of a $360,000 computer with an economic life of five years. The computer will be fully depreciated over five years using the straight-line method....
-
1. What is the slope of the Aggregate-Supply curve in the short run? In the long run? What shifts the AS curve(s)? 2. How does the interest-rate effect help explain the slope of the aggregate-demand...
-
Your analysis of Moen Corporations fixed asset accounts at the end of 2016 reveals the following information: 1. Moen owns two tracts of land. The first, which cost $18,000, is being held as a future...
-
Frequency distributions can aid the researcher in drawing charts and graphs.
-
The data show the average wind speed for 30 days in a large city. Construct an ungrouped frequency distribution for the data. 8 15 8 10 12 9 9 13 13 8 9 13 9 98 14 8 8 13 10 11 11 9 9 9 8 9 9 8...
-
Which type of fraud is associated with 50% of all auditor lawsuits? a. Kiting b. Fraudulent financial reporting c. Ponzi schemes d. Lapping
-
What is heteroscedasticity? What problems does it cause? How can we detect heteroscedasticity?
-
Explain why it is easier to forecast when the time series contains seasonal effects rather than a cyclical effect?
-
Explain why, given the same independent variables, the confidence interval for the mean value of y is always narrower than the corresponding confidence interval for any other value of y.
-
Under what conditions would you expect Paasche and Laspeyres indexes to be significantly different?
-
What is the difference between the ways the Paasche and Laspeyres price indexes are computed?
-
Show that the standard deviation A is 0 when is an eigenfunction of A.
-
Government is advised to tax goods whose demand curves are inelastic if the goal is to raise tax revenues. If the goal is to discourage consumption, then it ought to tax goods whose demand curves are...
-
An advertising manager decides to have an ad campaign in which 8 special calculators will be hidden at various locations in a shopping mall. If he has 17 locations from which to pick, how many...
-
A buyer decides to stock 8 different posters. How many ways can she select these 8 if there are 20 from which to choose?
-
Anderson Research Company decides to test-market a product in 6 areas. How many different ways can 3 areas be selected in a certain order for the first test?
-
The following condensed information was reported by Peabody Toys, Incorporated, for 2024 and 2023: Income statement information Net sales Net income Balance sheet information Current assets Property,...
-
A bond with face value of $1,000 has annual coupons, promised coupon rate of 8%, and 5 years to maturity. Investors require an expected return of 5% from this bond. The probability of default is 2%...
-
How does the increasing influence of technology on governance and civic participation affect democratic processes, and what safeguards are necessary to ensure that technology enhances rather than...
Study smarter with the SolutionInn App