

Question: Using the data from Data Set XI in Appendix B, construct a frequency distribution and draw a frequency polygon. Describe briefly the shape of the
Using the data from Data Set XI in Appendix B, construct a frequency distribution and draw a frequency polygon. Describe briefly the shape of the distribution for the number of pages in statistics books.
Data from Set XI Appendix B
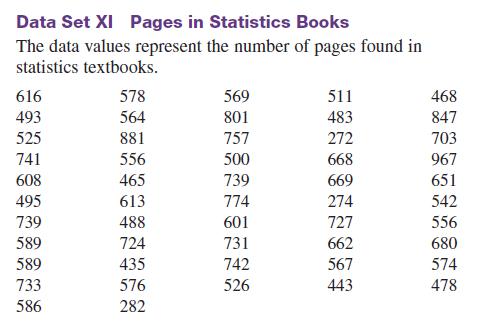
Data Set XI Pages in Statistics Books The data values represent the number of pages found in statistics textbooks. 616 493 525 741 608 495 739 589 589 733 586 578 564 881 556 465 613 488 724 435 576 282 569 801 757 500 739 774 601 731 742 526 511 483 272 668 669 274 727 662 567 443 468 847 703 967 651 542 556 680 574 478
Step by Step Solution
3.45 Rating (161 Votes )
There are 3 Steps involved in it
ANSWER To construct a frequency distribution for the number of pages in statistics books we need ... View full answer

Get step-by-step solutions from verified subject matter experts