

Question: Using the histogram shown here, do the following. a. Construct a frequency distribution; include class limits, class frequencies, midpoints, and cumulative frequencies. b. Construct a
Using the histogram shown here, do the following.
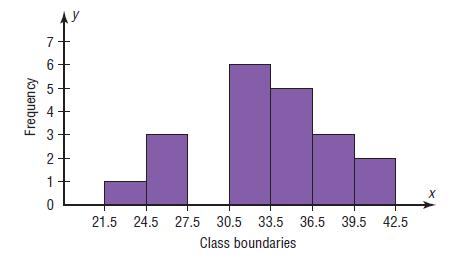
a. Construct a frequency distribution; include class limits, class frequencies, midpoints, and cumulative frequencies.
b. Construct a frequency polygon.
c. Construct an ogive.
7 6 Frequency A 5 3 2 1 0 21.5 24.5 27.5 30.5 33.5 36.5 39.5 42.5 Class boundaries X
Step by Step Solution
★★★★★
3.54 Rating (164 Votes )
There are 3 Steps involved in it
1 Expert Approved Answer
Step: 1 Unlock

a From the given Histogram Class Limits Class Boundaries Midpoints Frequency 22 24 215 2... View full answer
Question Has Been Solved by an Expert!
Get step-by-step solutions from verified subject matter experts
Step: 2 Unlock
Step: 3 Unlock