

The contingency table shows the results of a random sample of public elementary and secondary school teachers
Question:
The contingency table shows the results of a random sample of public elementary and secondary school teachers by gender and years of full-time teaching experience. At α = 0.01, can you conclude that gender is related to the years of full-time teaching experience?
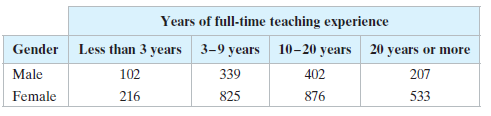
(a) Find the expected frequency for each cell in the contingency table,
(b) Identify the claim and state H0 and Ha,
(c) Determine the degrees of freedom, find the critical value, and identify the rejection region,
(d) Find the chi-square test statistic,
(e) Decide whether to reject or fail to reject the null hypothesis, and
(f ) Interpret the decision in the context of the original claim.
Fantastic news! We've Found the answer you've been seeking!
Step by Step Answer:
a Expected frequencies b The claim is gender is related to the years ...View the full answer

Answered By
FREDRICK MUSYOKI
Professional Qualities:
Solution-oriented.
Self-motivated.
Excellent problem-solving and critical thinking skills.
Good organization, time management and prioritization.
Efficient troubleshooting abilities.
Tutoring Qualities:
I appreciate students as individuals.
I am used to tailoring resources for individual needs.
I can integrate IT into student's lessons.
I am good at explaining concepts.
I am able to help students progress.
I have a wide curriculum knowledge.
1+ Reviews
10+ Question Solved
Related Book For 

Elementary Statistics Picturing The World
ISBN: 9780134683416
7th Edition
Authors: Ron Larson, Betsy Farber
Question Posted:
