

Question: The normal quantile plot represents heights of women from Data Set 1 in Appendix B. Examine the normal quantile plot and determine whether it depicts
The normal quantile plot represents heights of women from Data Set 1 in Appendix B.
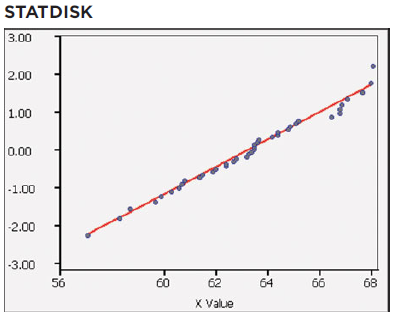
Examine the normal quantile plot and determine whether it depicts sample data from a population with a normal distribution.
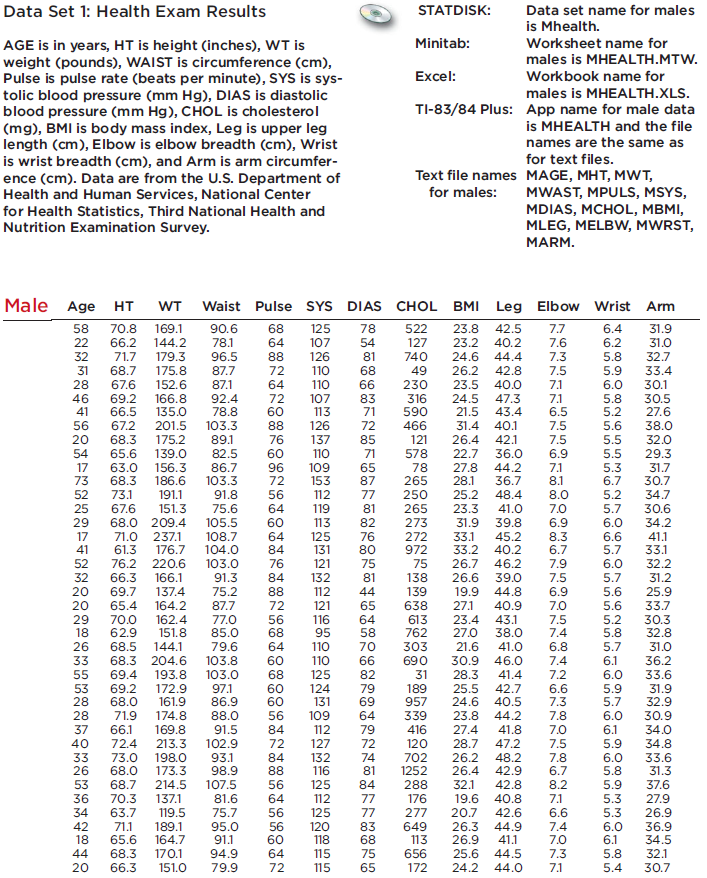
Data Set 1: Health Exam Results STATDISK: Data set name for males is Mhealth. AGE is in years, HT is height (inches), WT is Minitab: Worksheet name for males is MHEALTH.MTW. weight (pounds), WAIST is circumference (cm), Pulse is pulse rate (beats per minute), SYS is sys- tolic blood pressure (mm Hg), DIAS is diastolic blood pressure (mm Hg), CHOL is cholesterol (mg), BMI is body mass index, Leg is upper leg length (cm), Elbow is elbow breadth (cm), Wrist is wrist breadth (cm), and Arm is arm circumfer- ence (cm). Data are from the U.S. Department of Health and Human Services, National Center for Health Statistics, Third National Health and Nutrition Examination Survey. Excel: Workbook name for males is MHEALTH.XLS. TI-83/84 Plus: App name for male data is MHEALTH and the file names are the same as for text files. Text file names MAGE, MHT, MWT, MWAST, MPULS, MSYS, MDIAS, MCHOL, MBMI, MLEG, MELBW, MWRST, for males: MARM. Male Age HT WT Waist Pulse SYS DIAS CHOL BMI Leg Elbow Wrist Arm 70.8 66.2 58 169.1 90.6 68 125 78 522 23.8 42.5 7.7 6.4 31.9 78.1 96.5 144.2 179.3 175.8 152.6 166.8 66.5 135.0 201.5 175.2 6.2 5.8 5.9 6.0 5.8 5.2 64 88 72 64 22 107 54 127 23.2 40.2 7,6 31.0 32 71.7 126 110 81 740 24.6 44.4 7.3 32.7 31 68.7 87.7 68 26.2 42.8 49 230 7.5 7.1 33.4 28 67.6 87.1 110 66 23.5 40.0 30.1 69.2 46 41 92.4 78.8 72 60 107 113 83 71 24.5 21.5 7.1 6.5 7.5 316 47.3 43.4 30.5 590 466 121 27.6 38.0 56 67.2 103.3 89.1 82.5 86.7 103.3 88 126 72 31.4 40.1 5.6 20 54 68.3 76 137 85 26.4 42.1 7.5 5.5 5.5 32.0 65.6 139.0 60 110 109 153 71 578 22.7 36.0 44.2 36.7 6.9 29.3 17 63.0 68.3 156.3 186.6 191.1 151.3 68.0 209.4 105.5 96 72 65 87 78 265 27.8 28.1 7.1 8.1 5.3 6.7 31.7 30.7 73 52 250 73.1 67.6 91.8 56 112 77 25.2 48.4 8.0 5.2 34.7 64 41.0 7.0 30.6 25 29 17 41 75.6 119 113 81 265 23.3 5.7 60 82 273 272 972 31.9 39.8 6.9 6.0 6.6 5.7 34.2 71.0 237.1 61.3 176.7 125 131 41.1 33.1 108.7 104.0 103.0 91.3 64 84 76 80 33.1 33.2 45.2 40.2 8.3 6.7 52 76.2 220.6 46.2 76 84 121 75 81 75 138 139 638 26.7 7.9 7.5 6.0 5.7 32.2 32 66.3 166.1 132 26.6 39.0 31.2 6.9 7.0 20 20 29 18 69.7 137.4 75.2 88 112 44 19.9 44.8 5.6 25.9 65.4 164.2 87.7 72 121 65 27.1 40.9 5.6 5.2 5.8 33.7 613 762 70.0 162.4 151.8 77.0 85.0 56 68 116 95 64 58 23.4 27.0 21.6 30.9 43.1 38.0 7.5 7.4 30.3 32.8 62.9 68.5 68.3 204.6 193.8 26 144.1 79.6 64 31.0 110 110 70 303 41.0 6.8 5.7 103.8 103.0 33 60 66 690 46.0 41.4 42.7 40.5 7.4 6.1 36.2 55 53 28 125 124 131 69.4 68 60 60 82 31 28.3 7.2 6.0 5.9 5.7 6.0 33.6 69.2 68.0 172.9 161.9 97.1 86.9 79 69 64 189 957 339 25.5 24.6 6.6 7.3 31.9 32.9 30.9 28 71.9 174.8 88.0 56 109 23.8 44.2 7.8 6.1 5.9 6.0 5.8 5.9 5.3 5.3 6.0 6.1 37 66.1 169.8 91.5 84 112 79 72 416 27.4 41.8 47.2 7.0 7.5 34.0 40 72.4 213.3 102.9 72 127 120 28.7 34.8 73.0 68.0 33 198.0 173.3 93.1 98.9 84 88 132 116 74 81 702 1252 26.2 26.4 48.2 42.9 7.8 6.7 33.6 31.3 26 53 36 34 68.7 214.5 137.1 107.5 56 64 125 84 288 32.1 42.8 8.2 37.6 27.9 26.9 70.3 81.6 112 77 176 19.6 40.8 7.1 63.7 119.5 75.7 56 125 77 277 20.7 42.6 6.6 42 18 71.1 65.6 189.1 164.7 95.0 91.1 56 60 120 118 83 68 649 113 26.3 26.9 44.9 41.1 7.4 7.0 36.9 34.5 32.1 170.1 44.5 44.0 44 68.3 94.9 64 115 75 656 25.6 7.3 5.8 5.4 20 66.3 151.0 79.9 72 115 65 172 24.2 7.1 30.7 OO7ONO620
Step by Step Solution
3.35 Rating (158 Votes )
There are 3 Steps involved in it
A normal quantile plot also known as a normal QQ quantilequantile plot is a graphical tool used to d... View full answer

Get step-by-step solutions from verified subject matter experts