

The U.S. real unemployment rates over a 12-year period are listed. Use a time series chart to
Question:
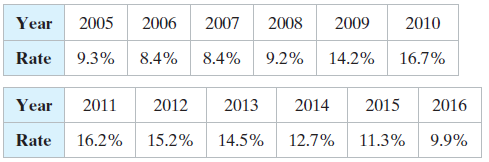
The U.S. real unemployment rates over a 12-year period are listed. Use a time series chart to display the data. Describe any patterns.
Fantastic news! We've Found the answer you've been seeking!
Step by Step Answer:
Sample answer The real unemployment rate varied by a couple ...View the full answer

Answered By
Chiranjib Thakur
I have no tutoring experience yet, but I can share my skills and knowledge gained from my education and work experiences. I have been a CPA since 2012 with 6 years of work experience in internal auditing and 4 years of work experience in accounting at the supervisory level.
1+ Reviews
10+ Question Solved
Related Book For 

Elementary Statistics Picturing The World
ISBN: 9780134683416
7th Edition
Authors: Ron Larson, Betsy Farber
Question Posted:
