

To compare the mean ages of male and female participants in a 10K race, you randomly select
Question:
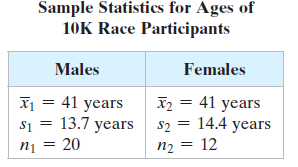
To compare the mean ages of male and female participants in a 10K race, you randomly select several ages from both sexes. The results are shown below. Construct a 95% confidence interval for the difference in mean ages of male and female participants in the race.
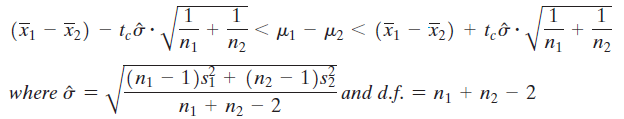
When the sampling distribution for x̅1 - x̅2 is approximated by a t-distribution and the populations have equal variances, you can construct a confidence interval for μ1 - μ2, as shown below.
construct the indicated confidence interval for μ1 - μ2. Assume the populations are approximately normal with equal variances.
DistributionThe word "distribution" has several meanings in the financial world, most of them pertaining to the payment of assets from a fund, account, or individual security to an investor or beneficiary. Retirement account distributions are among the most...
Fantastic news! We've Found the answer you've been seeking!
Step by Step Answer:
n 1s n 1s n 1...View the full answer

Answered By
Morgan Njeri
Very Versatile especially in expressing Ideas in writings.
Passionate on my technical knowledge delivery.
Able to multitask and able to perform under pressure by handling multiple challenges that require time sensitive solution.
Writting articles and video editing.
Revise written materials to meet personal standards and satisfy clients demand.
Help Online Students with their course work.
12+ Reviews
38+ Question Solved
Related Book For 

Elementary Statistics Picturing The World
ISBN: 9780134683416
7th Edition
Authors: Ron Larson, Betsy Farber
Question Posted:
