New Semester
Started
Get
50% OFF
Study Help!
--h --m --s
Claim Now
Question Answers
Textbooks
Find textbooks, questions and answers
Oops, something went wrong!
Change your search query and then try again
S
Books
FREE
Study Help
Expert Questions
Accounting
General Management
Mathematics
Finance
Organizational Behaviour
Law
Physics
Operating System
Management Leadership
Sociology
Programming
Marketing
Database
Computer Network
Economics
Textbooks Solutions
Accounting
Managerial Accounting
Management Leadership
Cost Accounting
Statistics
Business Law
Corporate Finance
Finance
Economics
Auditing
Tutors
Online Tutors
Find a Tutor
Hire a Tutor
Become a Tutor
AI Tutor
AI Study Planner
NEW
Sell Books
Search
Search
Sign In
Register
study help
engineering
electronics fundamentals a systems approach
Electronics Fundamentals A Systems Approach 1st Edition Thomas Floyd - Solutions
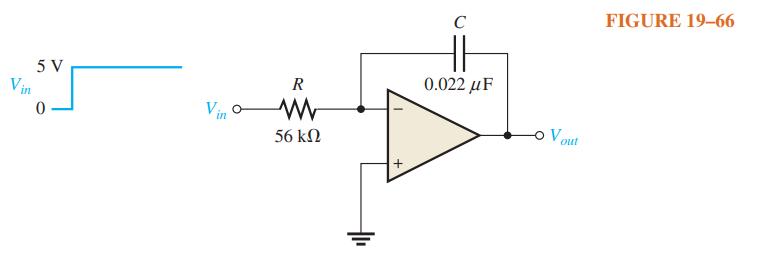
Determine the rate of change of the output voltage in response to the step input to the ideal integrator in Figure 19–66. Vin 5 V 0 Vin R 56 ΚΩ HH 0.022 μF o Vout FIGURE 19-66
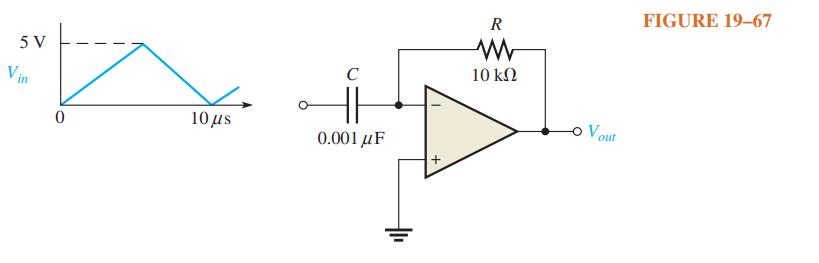
A triangular waveform is applied to the input of the ideal differentiator in Figure 19–67 as shown. Determine what the output should be, and draw its waveform in relation to the input. 5 V 0 10 s C 0.001 F R 10 -O V out FIGURE 19-67
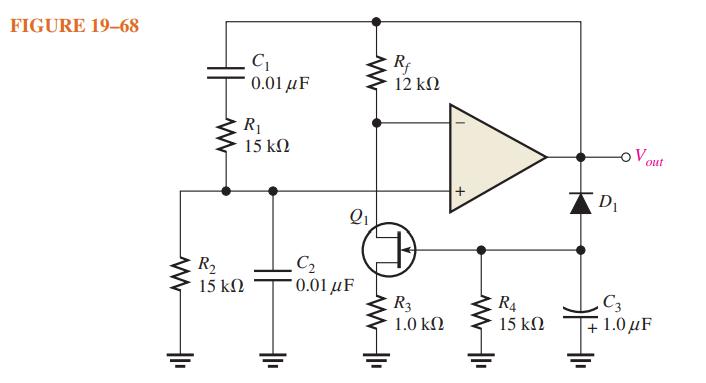
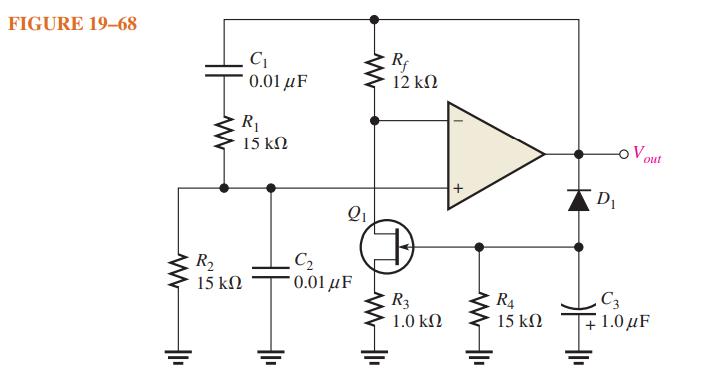
Determine the JFET drain-to-source resistance in Figure 19–68 that produces a closed-loop gain of 3. FIGURE 19–68 R₂ 15 ΚΩ C₁ 0.01 με R₁ 15 ΚΩ Οι C € 0.01 με Rf 12 ΚΩ R3 1.0 ΚΩ ΜΙ R4 15 ΚΩ D₁ OV out C + 1.0 με
Find the frequency of oscillation for the Wien-bridge oscillator in Figure 19–68. FIGURE 19-68 R, 15 ΚΩ C 0.01 με R₁ 15 ΚΩ Οι C₂ 10.01 με Rf 12 ΚΩ R3 1.0 ΚΩ ΗΜ R4 15 ΚΩ -OV out D₁ C3 + 1.0 με
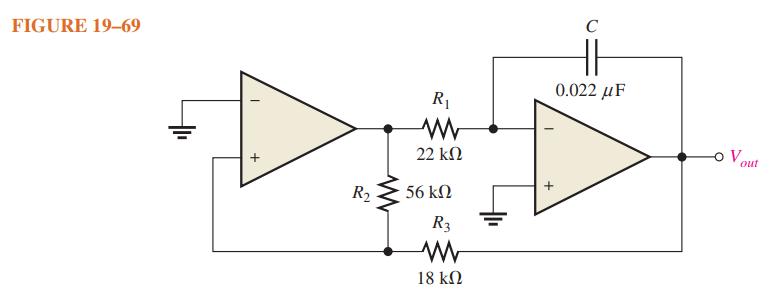
What type of signal does the circuit in Figure 19–69 produce? Determine the frequency of the output. FIGURE 19-69 + R₂ R₁ Μ 22 ΚΩ 56 ΚΩ R3 Μ 18 ΚΩ + C 0.022 με Vout
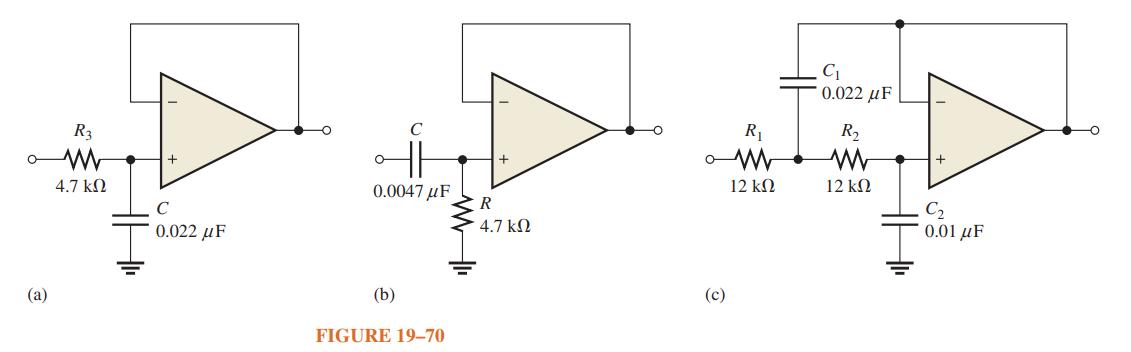
Determine the number of poles in each active filter in Figure 19–70, and identify its type. (2) R3 4.7 ΚΩ C 0.022 με O 0.0047 με (b) FIGURE 19–70 R 4.7 ΚΩ R₁ ΟΜ 12 ΚΩ (c) C₁ ` 0.022 με R₂ 12 ΚΩ C 0.01 με
Calculate the critical frequencies for the filters in Figure 19–70. (2) R3 4.7 ΚΩ C 0.022 με C 0.0047 με (b) FIGURE 19-70 R 4.7 ΚΩ (c) R₁ 12 ΚΩ C₁ ΄ 0.022 με R₂ 12 ΚΩ + C 0.01 με
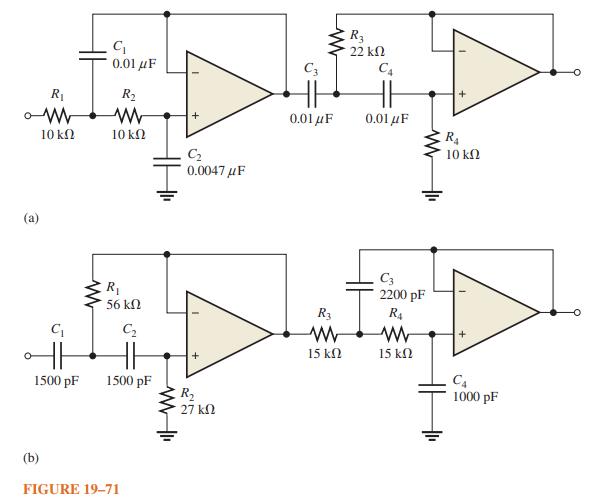
Determine the bandwidth and center frequency of each filter in Figure 19–71. R₁ αλ 10 ΚΩ C₁ 1500 pF (b) Μ C₁ 0.01 ΜΕ R₂ Μ 10 ΚΩ R₁ 56 ΚΩ FIGURE 19-71 C₂ H 1500 pF ΗΜ + C₂ 0.0047 με + R₂ 27 ΚΩ C Μ 0.01 MF R3 Μ 15 ΚΩ R3 22 ΚΩ CA 0.01 ΜΕ C3 2200
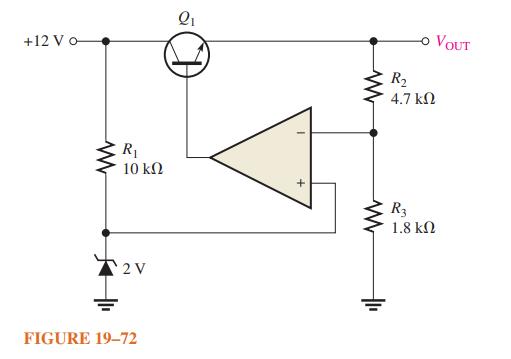
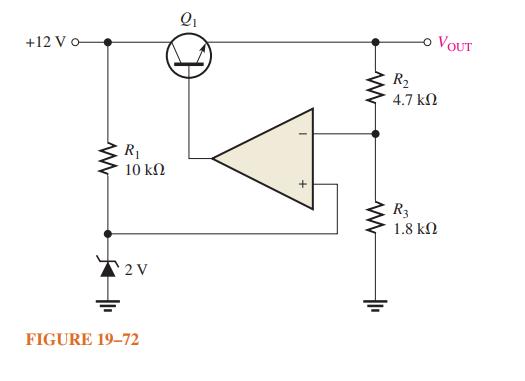
Determine the output voltage for the series regulator in Figure 19–72. +12 V σ ww R₁ 10 ΚΩ 2V FIGURE 19–72 Οι I + Μ www VOUT R₂ 4.7 ΚΩ R3 1.8 ΚΩ
If the zener voltage is 2.7 V instead of 2 V in Figure 19–72, what is the output voltage? +12 Vo w R₁ 10 ΚΩ 2V FIGURE 19-72 Οι I + Μ R₂ 4.7 ΚΩ R3 1.8 ΚΩ VOUT
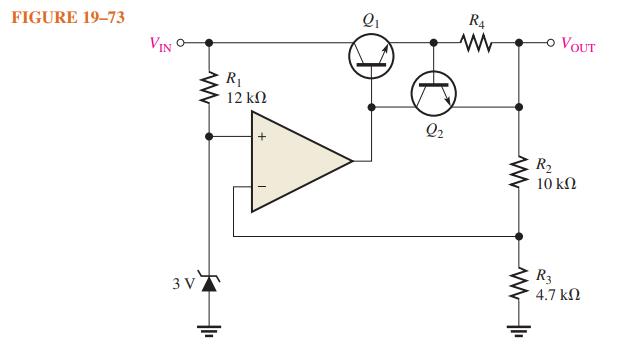
A series voltage regulator with constant-current limiting is shown in Figure 19–73. Determine the value of R4 if the load current is to be limited to a maximum value of 250 mA. What power rating must R4 have? FIGURE 19-73 VIN C 3 V www R₁ 12 ΚΩ Q₁ 2₂ R4 www www VOUT R₂ 10 ΚΩ R3 4.7
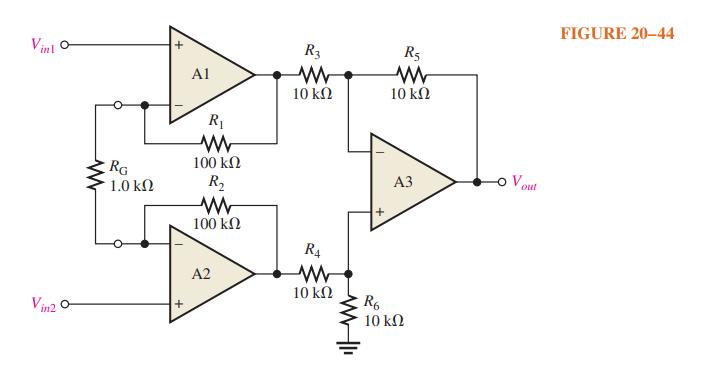
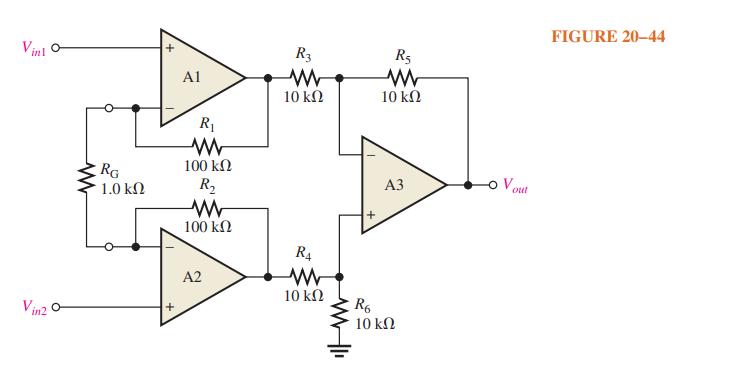
Determine the voltage gains of op-amps A1 and A2 for the instrumentation amplifier configuration in Figure 20–44. Vinz O RG 1.0 ΚΩ + Al R₁ Μ 100 ΚΩ R₂ Μ 100 ΚΩ Α2 R3 Μ 10 ΚΩ RA www 10 ΚΩ + R5 Μ 10 ΚΩ A3 R6 10 ΚΩ -O Vout FIGURE 20-44
Find the overall voltage gain of the instrumentation amplifier in Figure 20–44. Vini 0- in2 RG 1.0 ΚΩ + A1 R₁ Μ 100 ΚΩ R₂ Μ 100 ΚΩ Α2 R3 Μ 10 ΚΩ R4 Μ 10 ΚΩ ΜΙ + R6 R5 Μ 10 ΚΩ A3 10 ΚΩ o Vout FIGURE 20-44
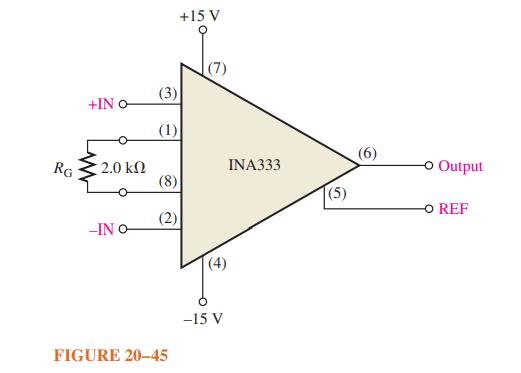
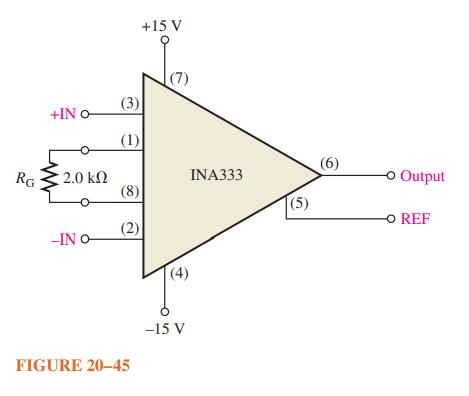
What is the voltage gain of the INA333 instrumentation amplifier in Figure 20–45? RG +IN O 2.0 ΚΩ -IN O (3) (1) (8) (2) FIGURE 20-45 +15 V (7) (4) -15 V INA333 (5) (6) -o Output -O REF
Determine the value of RG in Figure 20–45 for a voltage gain of 20.6. RG +IN O - 2.0 ΚΩ -IN O (3) (1) +15 V (8) (2) FIGURE 20-45 (7) € -15 V INA333 (5) (6) -o Output -O REF
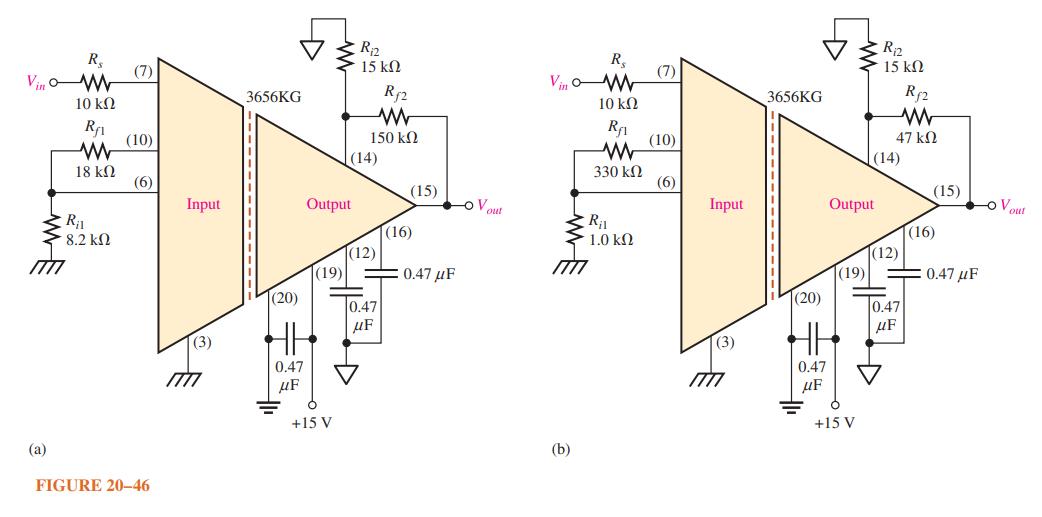
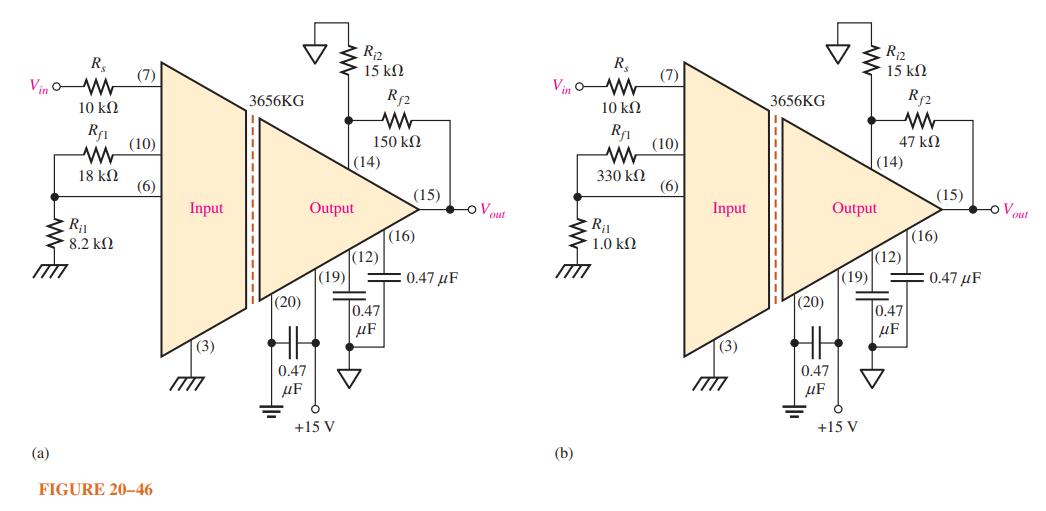
Determine the total voltage gain of each 3656KG in Figure 20–46. Vino WE (a) R₂ 10 ΚΩ R₁ ww 18 ΚΩ R₁1 - 8.2 ΚΩ (7) (10) (6) FIGURE 20-46 Input (3) 7 3656KG (20) 0.47 μF Output R₁2 15 ΚΩ +15 V Rf2 www 150 ΚΩ (14) (15) (12) (19) = 0.47μF 0.47 μF (16) OV out Vino (b) R₂ 10
The op-amp in the input stage of a 3656KG isolation amplifier has a voltage gain of 30. The output stage is set for a gain of 10. What is the total voltage gain of this device?
Specify how you would change the total gain in Figure 20–46 (b) to approximately 440 by changing only the gain of the output stage.Data in Figure 20–46 (b) R₂ Vino www 10 ΚΩ (b) Rf1 www 330 ΚΩ R₁1 1.0 ΚΩ (7) (10) (6) Input 3656KG Output (19) (20) HE 0.47 μF +15 V R₁2 15
Specify how you would connect each amplifier in Figure 20–46 for unity gain. Vino ww (a) R$ 10 ΚΩ R₁1 W 18 KQ Ril 8.2 ΚΩ (7) (10) (6) FIGURE 20-46 Input (3) 3656KG (20) Output HH 0.47 μF R₁2 15 ΚΩ +15 V Rf2 ww 150 ΚΩ (14) (15) (12) (19) = 0.47μF 0.47 μF (16) o
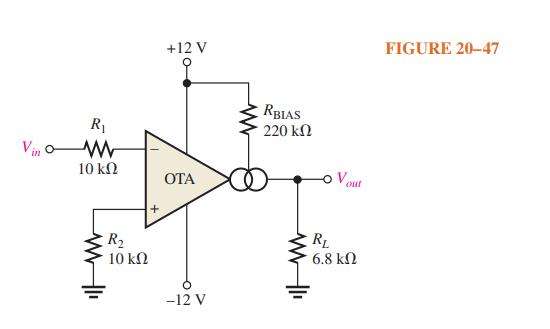
If a 10 kΩ rheostat is added in series with the bias resistor in Figure 20–47, what are the minimum and maximum voltage gains? Vin o R₁ Μ 10 ΚΩ R₂ 10 ΚΩ + +12 V ΟΤΑ –12 V RBIAS ´ 220 ΚΩ Vout RL 6.8 ΚΩ FIGURE 20-47
A certain OTA has an input voltage of 10 μV and an output current of 10 mA. What is the transconductance?
Determine the output voltage for the clamping circuit in Figure 20–51 for the input shown. 5 V- C + Vin o 31 0.1 μF A FIGURE 20-51 www R₁ 10 ΚΩ -O Vout RL 1.0 ΜΩ
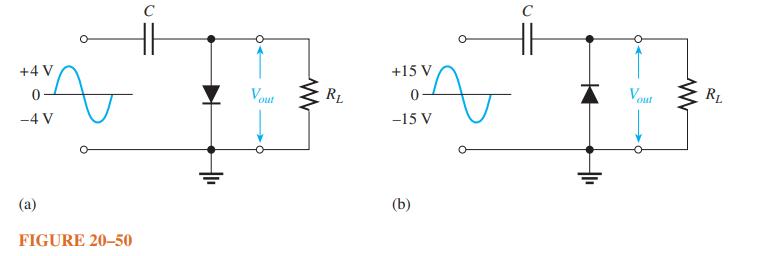
Describe the output waveform of each circuit in Figure 20–50. Assume that the RLC time constant is much greater than the period of the input signal. +4 V -4 V (a) t FIGURE 20-50 C Vout www RL +15 V 0 -15 V (b) C v Vout www RL
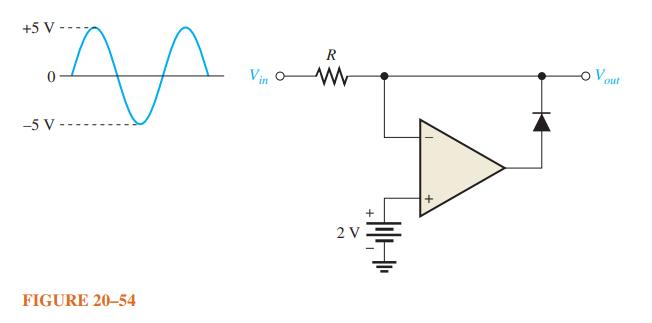
Determine the output waveform for the active limiter in Figure 20–54. +5 V AA -5 V FIGURE 20-54 Vin R www 2 V Jolt V. out
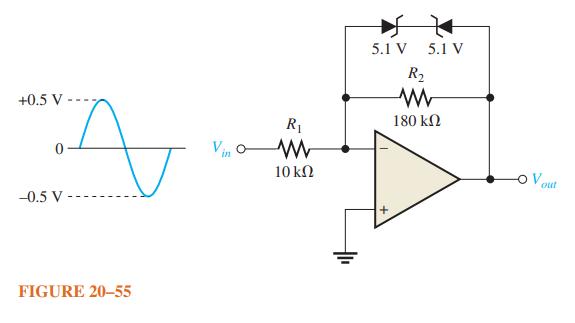
Show the output voltage for the zener diode limiter in Figure 20–55. +0.5 V A -0.5 V FIGURE 20-55 R₁ www 10 ΚΩ 5.1 V 5.1 V R₂ www 180 ΚΩ out
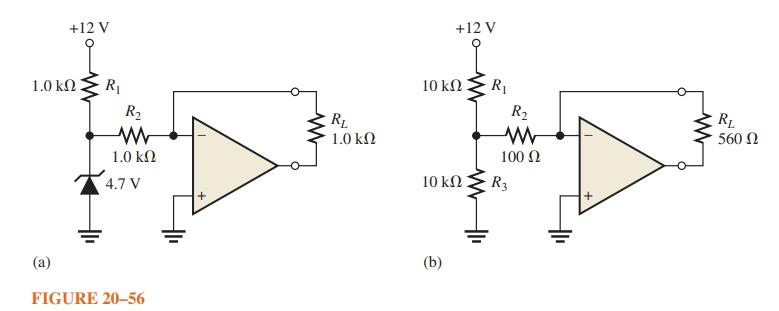
Determine the load current in each circuit of Figure 20–56. 1.0 ΚΩ (2) +12 V R₁ R₂ Μ 1.0 ΚΩ 4.7 V FIGURE 20-56 RL 1.0 ΚΩ 10 ΚΩ 10 ΚΩ +12 V Ξ R₁ R₂ Μ 100 Ω R3 RL 560 Ω
Devise a circuit for remotely sensing temperature and producing a proportional voltage that can then be converted to digital form for display. A thermistor can be used as the temperature sensing element.
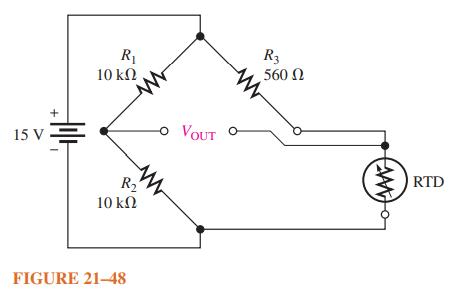
At what resistance value of the RTD will the bridge circuit in Figure 21–48 be balanced if the wires running to the RTD each have a resistance of 10 Ω? + 15 V. R₁ 10 ΚΩ www R₂ 10 ΚΩ FIGURE 21-48 VOUT www O R3 560 Ω (MAN) RTD
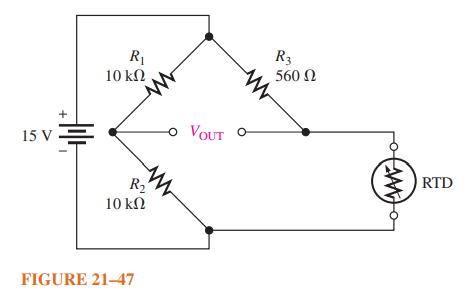
At what resistance value of the RTD will the bridge circuit in Figure 21–47 be balanced if the wires running to the RTD each have a resistance of 10 Ω? 15 V R₁ 10 ΚΩ R₂ 10 ΚΩ FIGURE 21-47 www www O VOUT www O R3 560 Ω (MAN) RTD
You have two thermocouples. One is a K type and the other is a T type. In general, what do these letter designations tell you?
A certain material being measured undergoes a strain of 3 parts per million. The strain gage has a nominal resistance of 600 Ω and a gage factor of 2.5. Determine the resistance change in the strain gage.
Explain how a strain gage can be used to measure pressure.
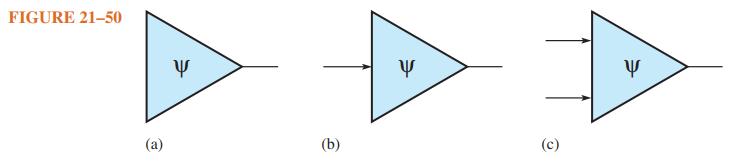
Identify and compare the three symbols in Figure 21–50. FIGURE 21-50 (a) Y (b) Y (c) Y
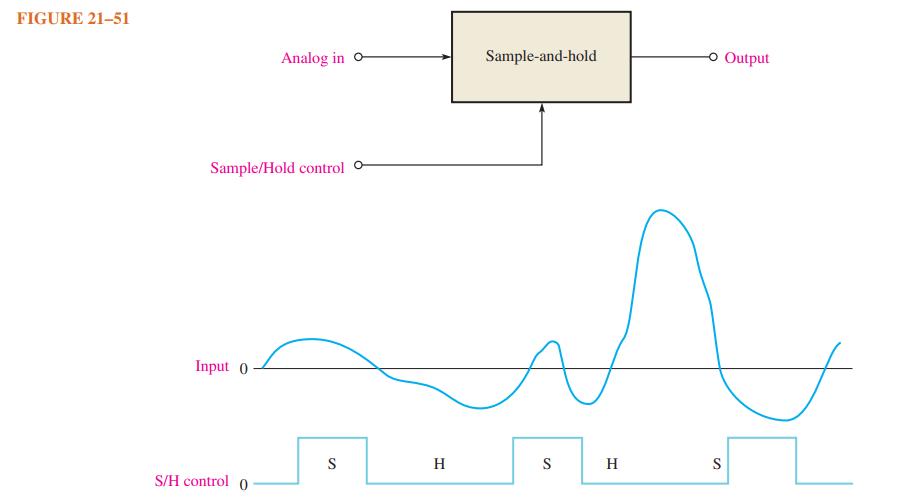
Determine the output voltage waveform for the sample-and-hold circuit in Figure 21–51 given the analog input and the control voltage waveforms shown. Sample is the high control level. The tracking interval should be included. FIGURE 21-51 Sample/Hold control o Input 0 Analog in O S/H
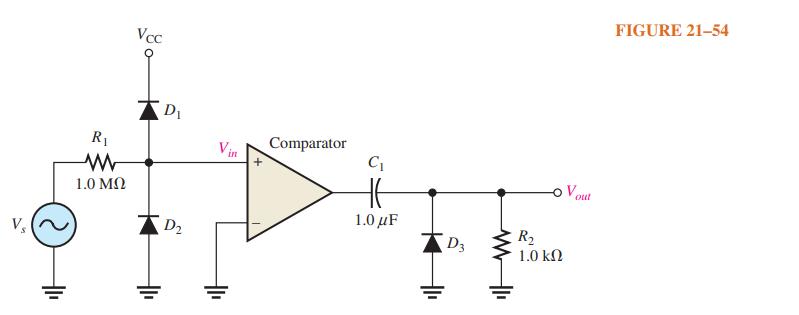
What change to the circuit in Figure 21–54 would you make if you wanted to have positive triggers on the negative slope of the input waveform? R 1.0 Vcc D D Vin Comparator C 1.0 F D3 -OV out R 1.0 FIGURE 21-54
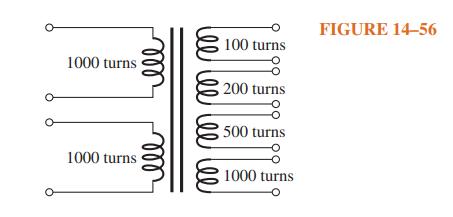
In Figure 14–56, each primary winding can accommodate 120 V ac. Show how the primaries should be connected for 240 V ac operation. Determine each secondary voltage. 1000 turns 1000 turns еее 100 turns 200 turns 500 turns 1000 turns FIGURE 14-56
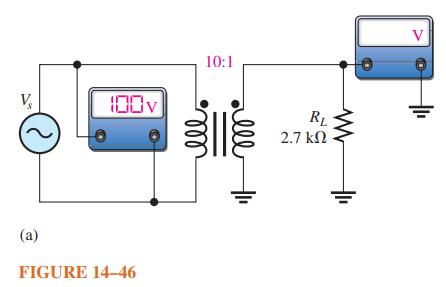
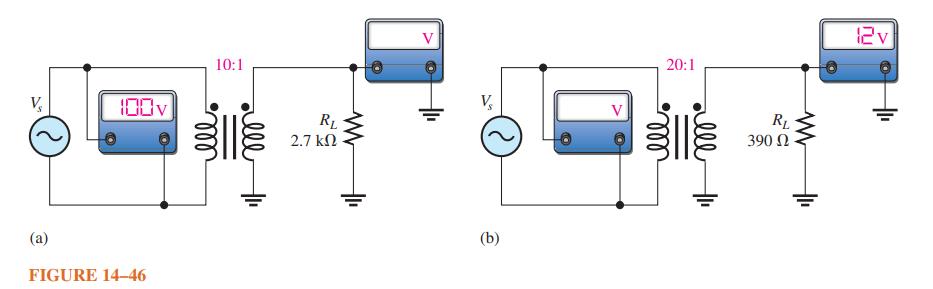
If RL is doubled in the circuit of Figure 14–46 (a), what would the secondary meter read? S (a) 100v FIGURE 14-46 10:1 RL 2.7 ΚΩ V
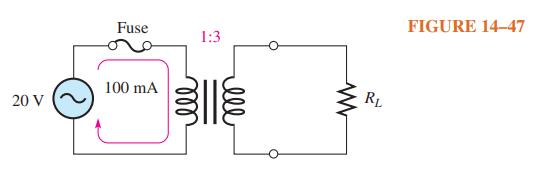
Determine Isec in Figure 14–47. 20 V Fuse 100 mA lell 1:3 ell www RL FIGURE 14-47
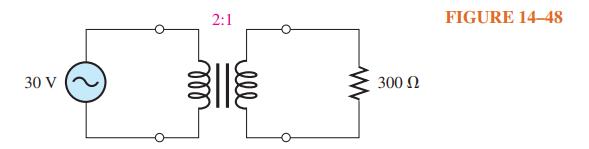
Determine the following quantities in Figure 14–48:(a) Secondary voltage (b) Secondary current (c) Primary current (d) Power in the load. 30 V 2:1 www 300 Ω FIGURE 14-48
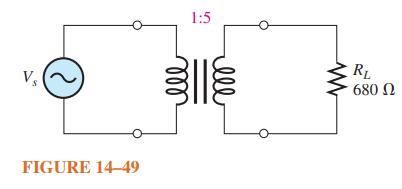
What is the load resistance as seen by the source in Figure 14–49? V₂ FIGURE 14-49 1:5 RL 680 Ω
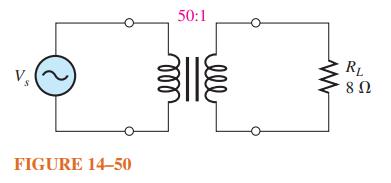
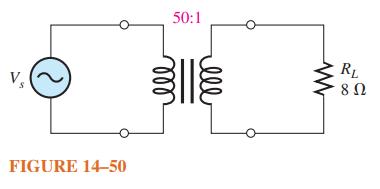
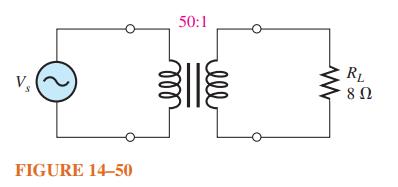
What is the resistance reflected into the primary circuit in Figure 14–50? FIGURE 14-50 50:1 RL 8 Ω
What is the primary current (rms) in Figure 14–50 if the rms source voltage is 120 V? $ FIGURE 14-50 50:1 мее www RL 8 Ω
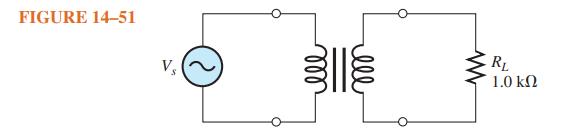
What must be the turns ratio in Figure 14–51 in order to reflect 300 Ω into the primary circuit? FIGURE 14-51 lll ell RL 1.0 ΚΩ
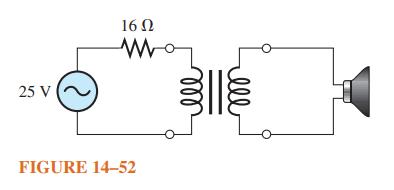
For the circuit in Figure 14–52 , find the turns ratio required to deliver maximum power to the 4 Ω speaker. 25 V 16Ω FIGURE 14-52
In Figure 14–52, what is the maximum power in watts delivered to the speaker? 25 V 16 Ω FIGURE 14-52 ell
In a certain transformer, the input power to the primary is 100 W. If 5.5 W are dissipated in the winding resistances, what is the output power to the load, neglecting any other losses?
What is the efficiency of the transformer in Problem 27? Data in Problem 27.In a certain transformer, the input power to the primary is 100 W. If 5.5 W are dissipated in the winding resistances, what is the output power to the load, neglecting any other losses?
Determine the coefficient of coupling for a transformer in which 2% of the total flux generated in the primary does not pass through the secondary.
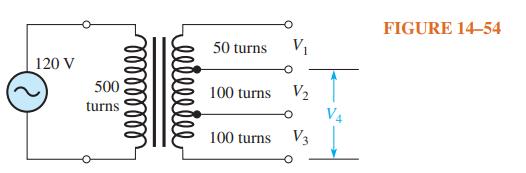
Determine each unknown voltage indicated in Figure 14–54. 120 V 500 turns 50 turns V₁ 100 turns V₂ 100 turns V3 V₁ FIGURE 14-54
What kVA rating is required for a transformer that must handle a maximum load current of 10 A with a secondary voltage of 2.5 kV?
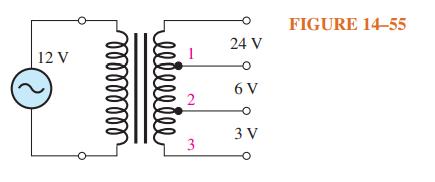
Using the indicated secondary voltages in Figure 14–55, determine the turns ratio of the primary winding to each tapped section. 12 V lllllll elieeeee 2 3 24 V -O 6 V -O 3 V FIGURE 14-55
Determine the turns ratios from each primary to each secondary in Figure 14–56. 1000 turns 1000 turns ell ell 100 turns 18 200 turns 500 turns 1000 turns FIGURE 14-56
When you apply 120 V ac across the primary winding of a transformer and check the voltage across the secondary winding, you get 0 V. Further investigation shows no primary or secondary current. List the possible faults. What is your next step in isolating the problem?
What is likely to happen if the primary winding of a transformer shorts?
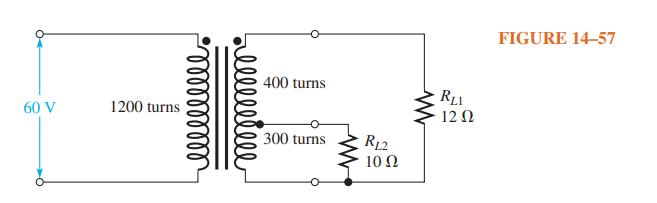
For the loaded, tapped-secondary transformer in Figure 14–57, determine the following:(a) All load voltages and currents (b) The resistance looking into the primary. 60 V 1200 turns 400 turns 300 turns R12 10 Ω RLI 12 Ω FIGURE 14-57
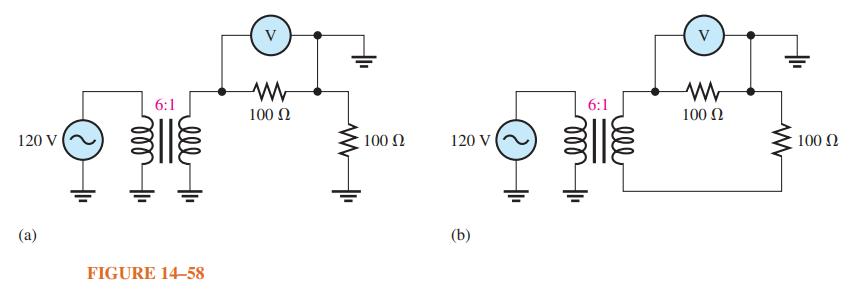
Determine the voltage measured by each voltmeter in Figure 14–58. The bench-type meters have one terminal that connects to ground as indicated. 120 V (a) ell 6:1 FIGURE 14-58 V W 100 Ω 100 Ω 120 V (b) 6:1 ell V www 100 Ω 100 Ω
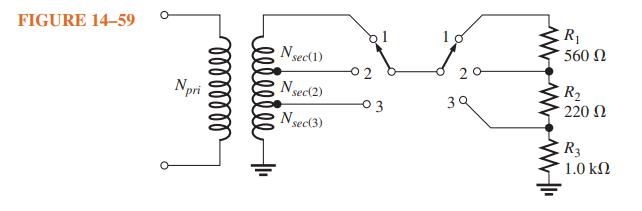
Find the appropriate turns ratio for each switch position in Figure 14–59 in order to transfer the maximum power to each load when the internal source resistance is 10 Ω. Specify the number of turns for the secondary winding if the primary winding has 100 turns. FIGURE
What must the turns ratio be in Figure 14–50 to limit the primary current to 3 mA with a source voltage of 120 V? Assume an ideal transformer and source. FIGURE 14–50 50:1 RL 8 Ω
Assume 120 V is applied to the primary of a transformer with a VA rating of 10 VA. The output voltage is 12.6 V. What is the smallest resistor that can be connected across the secondary?
A step-down transformer uses 120 V on the primary and 10 V on the secondary. If the secondary is rated for a maximum of 1 A, what fuse rating should be selected on the primary side?
It is required that an integrator have a time constant of approximately 6 ms. If C = 0. 22 μF, what standard value of R must be used?
For the capacitor in the integrator of Problem 3 to fully charge during a pulse, what must be the minimum width of the pulse? Data in Problem 3It is required that an integrator have a time constant of approximately 6 ms. If C = 0. 22 μF, what standard value of R must be used?
A 20 V pulse is applied to an RC integrator. The pulse width equals one time constant. To what voltage does the capacitor charge during the pulse? Assume that it is initially uncharged.
Repeat Problem 5 for the following values of tW:Data in Problem 5A 20 V pulse is applied to an RC integrator. The pulse width equals one time constant. To what voltage does the capacitor charge during the pulse? Assume that it is initially uncharged.(a) 2t (b) 3t (c) 4t (d) 5t.
Show the approximate shape of an integrator output voltage where 5t is much less than the pulse width of a 10 V square wave input. Repeat for the case in which 5t is much larger than the pulse width.
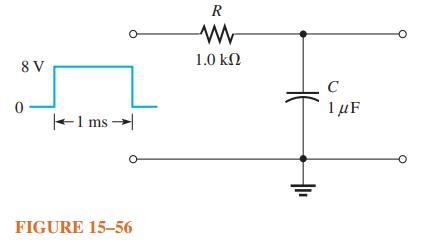
Determine the output voltage for an integrator with a single-pulse input, as shown in Figure 15–56. For repetitive pulses, how long will it take this circuit to reach steady state? 8 V 0 1 ms → O FIGURE 15-56 R WWW 1.0 ΚΩ C 1 μF
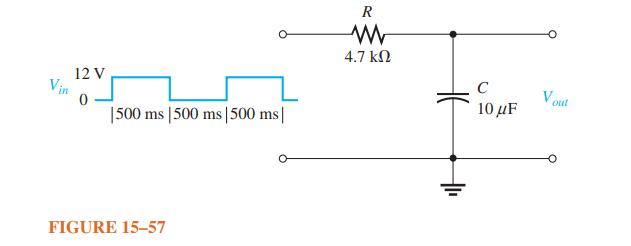
Draw the integrator output in Figure 15–57 showing maximum voltages. Vin 12 V 0 1500 ms 500 ms | 500 ms | FIGURE 15-57 R www 4.7 ΚΩ +₁₁ C 10 μF Vout
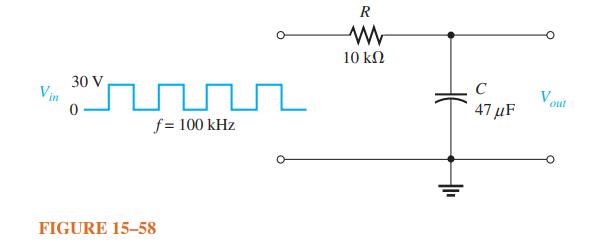
What is the steady-state output voltage of the RC integrator with a square wave input shown in Figure 15–58? Vin 30V 0 yri f= 100 kHz FIGURE 15–58 R WW 10 k0 C 47uF
Repeat Problem 7 for an RC differentiator. Data in Problem 7.Show the approximate shape of an integrator output voltage where 5t is much less than the pulse width of a 10 V square wave input. Repeat for the case in which 5t is much larger than the pulse width.
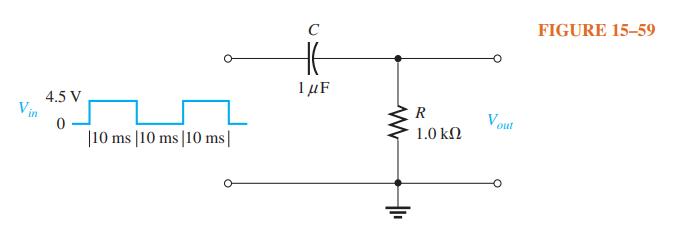
Draw the differentiator output in Figure 15–59, showing maximum voltages. Vin 4.5 V 0 10 ms 10 ms | 10 ms] C 1 μF WWW R 1.0 ΚΩ Vout FIGURE 15-59
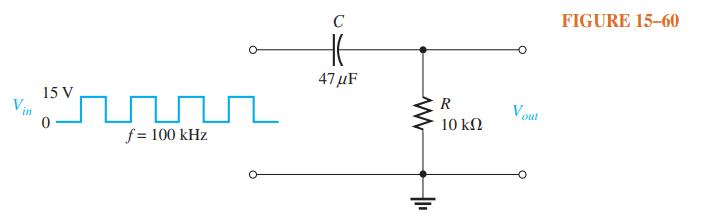
What is the steady-state output voltage of the differentiator with the square wave input shown in Figure 15–60? Vin 15 V 0 f = 100 kHz C HE 47μF www R 10 ΚΩ Vout FIGURE 15-60
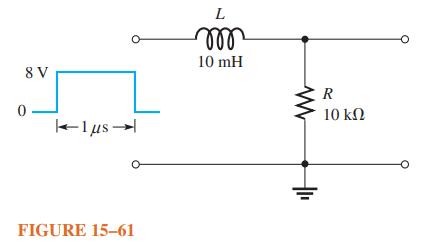
Determine the output voltage for the circuit in Figure 15–61. A single-pulse input is applied as shown. 8 V 0 1μs- FIGURE 15-61 L m 10 mH R 10 ΚΩ
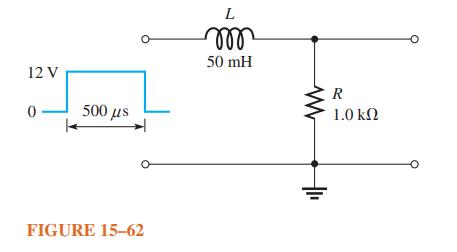
Draw the integrator output in Figure 15–62, showing maximum voltages. 12 V 0 500 FIGURE 15-62 L 50 mH R 1.0
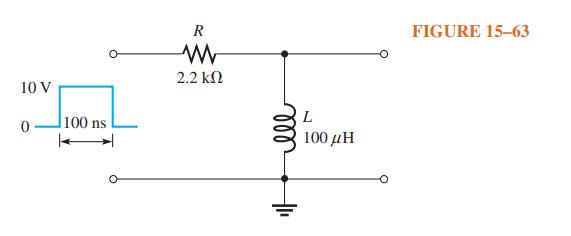
Draw the output waveform if a periodic pulse waveform with tW = 250 ns and T = 600 ns is applied to the circuit in Figure 15–63. 10 V 0 100 ns R 2.2 lll L 100 FIGURE 15-63
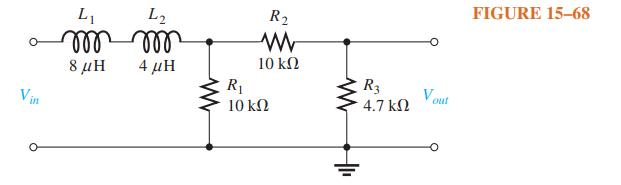
Determine the time constant in Figure 15–68. Is this circuit an integrator or a differentiator? Vin L₁ 8 μΗ L2 mor 4 μΗ R₂ Μ 10 ΚΩ R₁ 10 ΚΩ R3 4.7 ΚΩ Vout FIGURE 15–68
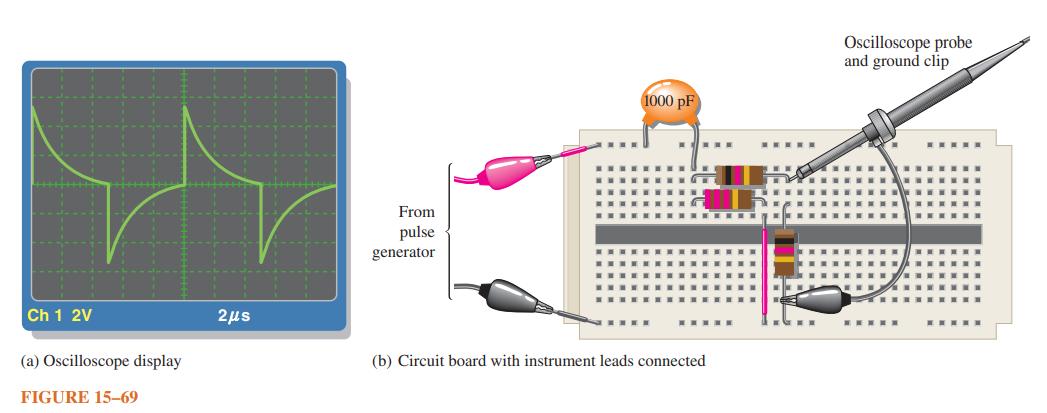
Draw the schematic for the circuit in Figure 15–69 and determine if the oscilloscope presentation is correct. Ch 1 2V (a) Oscilloscope display FIGURE 15-69 2s From pulse generator 1000 pF (b) Circuit board with instrument leads connected Oscilloscope probe and ground clip
List two semiconductive materials.
How many valence electrons do semiconductors have?
If 120 V ac are connected to the primary of a transformer with a turns ratio of 1.5, what is the secondary voltage?
A certain transformer has 250 turns in its primary winding. In order to double the secondary voltage, how many turns must be in the secondary winding?
How many primary volts must be applied to a transformer with a turns ratio of 10 to obtain a secondary voltage of 60 V ac?
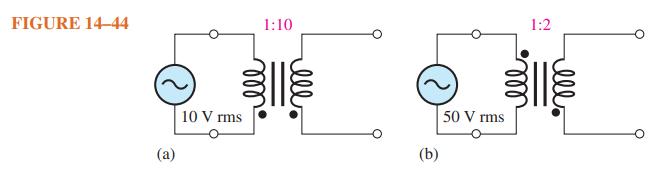
For each transformer in Figure 14–44, draw the secondary voltage showing its relationship to the primary voltage. Also indicate the amplitude. FIGURE 14-44 (a) 10 V rms 1:10 (b) 50 V rms 1:2
To step 120 V down to 30 V, what must be the turns ratio?
The primary winding of a transformer has 1200 V across it. What is the secondary voltage if the turns ratio is 0.2?
How many primary volts must be applied to a transformer with a turns ratio of 0.1 to obtain a secondary voltage of 6 V ac?
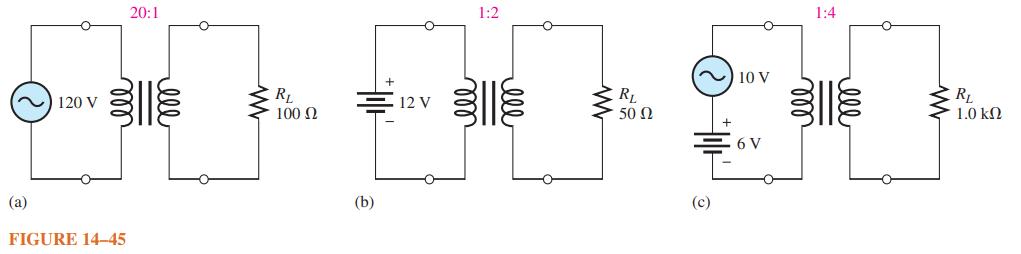
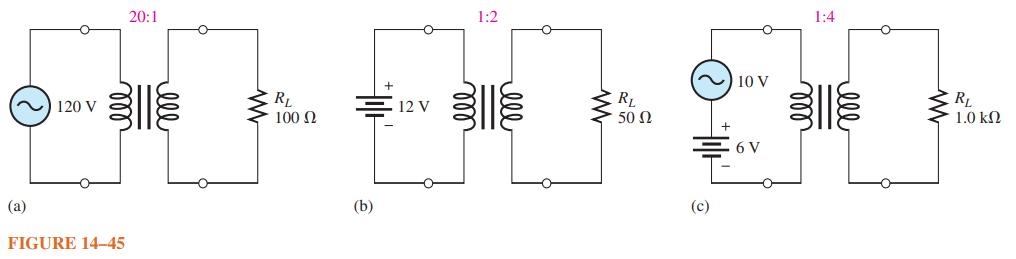
What is the voltage across the load in each circuit in Figure 14–45? ~ ) 120 V (2) FIGURE 14-45 20:1 RL 100 Ω (b) 12 V 1:2 www RL 50 Ω (c) lov 6V 1:4 RL 1.0 ΚΩ
If the bottom of each secondary winding in Figure 14–45 were grounded, would the values of the load voltages be changed? (a) 120 V FIGURE 14-45 20:1 ell RL 100 Ω (b) 12 V ell 1:2 = www RL 50 Ω ~) 10 V (c) 6 V 1:4 RL 1.0 ΚΩ
Determine the unspecifi ed meter readings in Figure 14–46. (a) 100v FIGURE 14-46 10:1 m RL 2.7 ΚΩ www (b) 20:1 RL 390 Ω 12v O
Convert the following values from microfarads to picofarads: (a) 0.1 μF (b) 0.0025 μF (c) 5 μF
Convert the following values from picofarads to microfarads:(a) 1000 pF (b) 3500 pF (c) 250 pF
Convert the following values from farads to microfarads: (a) 0.0000001 F (b) 0.0022 F (c) 0.0000000015 F
What size capacitor is capable of storing 10 mJ of energy with 100 V across its plates?
A mica capacitor has a plate area of 20 cm2 and a dielectric thickness of 2.5 mils. What is its capacitance?
An air capacitor has plates with an area of 0.1 m2. The plates are separated by 0.01 m. Calculate the capacitance.
At ambient temperature (25°C), a certain capacitor is specified to be 1000 pF. It has a negative temperature coefficient of 200 ppm/°C. What is its capacitance at 75°C ?
A 0.001 μF capacitor has a positive temperature coefficient of 500 ppm/°C. How much change in capacitance will a 25°C increase in temperature cause?
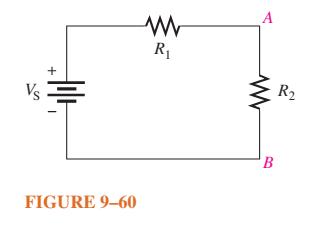
Show how to connect an electrolytic capacitor across points A and B in Figure 9–60. Vs + FIGURE 9–60 R₁ A 싸 B R2
In the construction of a stacked-foil mica capacitor, how is the plate area increased?
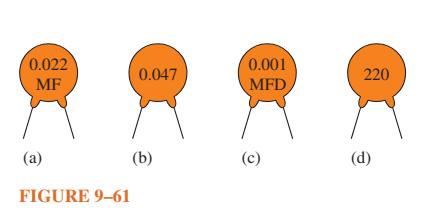
Determine the value of the typographically labeled ceramic disk capacitors in Figure 9–61. 0.022 MF (a) FIGURE 9–61 0.047 一 (b) 0.001 MFD (c) 220 (d)
What type of capacitor has the higher dielectric constant, mica or ceramic?
Showing 200 - 300
of 641
1
2
3
4
5
6
7
Step by Step Answers