

Question: The st graph for a train has been determined experimentally. From the data, construct the vt and at graphs for the motion. s (m) 600
The s–t graph for a train has been determined experimentally. From the data, construct the v–t and a–t graphs for the motion.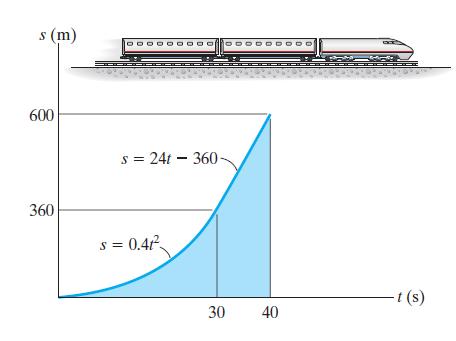
s (m) 600 360 s 24t360- s = 0.41 30 40 Hote -t (s)
Step by Step Solution
★★★★★
3.55 Rating (162 Votes )
There are 3 Steps involved in it
1 Expert Approved Answer
Step: 1 Unlock

vt Graph The velocity in terms of time t can be obtained by applying v ... View full answer
Question Has Been Solved by an Expert!
Get step-by-step solutions from verified subject matter experts
Step: 2 Unlock
Step: 3 Unlock