

Question: The st graph for a train has been experimentally determined. From the data, construct the vt and at graphs for the motion; 0 t
The s–t graph for a train has been experimentally determined. From the data, construct the v–t and a–t graphs for the motion; 0 ≤ t ≤ t2. For 0 ≤ t ≤ t1, the curve is a parabola, and then it becomes straight for t ≥ t1. Given: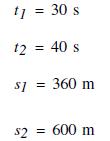
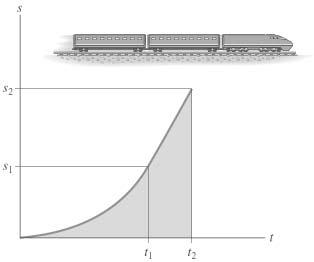
t = 30 s 12 = 40 s $1 = 360 m : 600 m $2 =
Step by Step Solution
★★★★★
3.54 Rating (161 Votes )
There are 3 Steps involved in it
1 Expert Approved Answer
Step: 1 Unlock

k1 5 Velocity ms T1 0001t1t1 30 Splt k1 Sp2t Sp1 11 ... View full answer
Question Has Been Solved by an Expert!
Get step-by-step solutions from verified subject matter experts
Step: 2 Unlock
Step: 3 Unlock