

Figure 19.19is a time plot of quarterly natural gas sales (in billions of BTU) of a certain
Question:
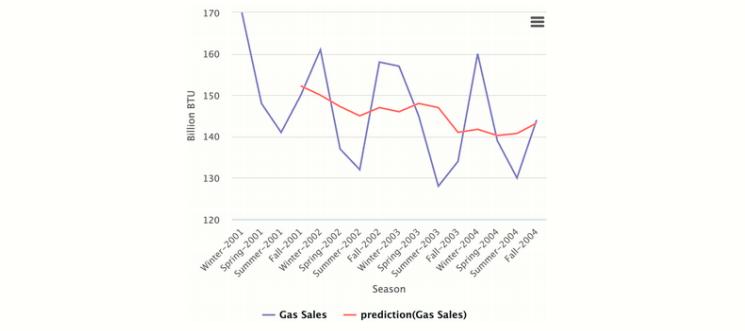
Figure 19.19is a time plot of quarterly natural gas sales (in billions of BTU) of a certain company, over a period of four years (data is available in NaturalGasSales.csv, data courtesy of George McCabe). The company’s analyst is asked to use a moving average to forecast sales in Winter 2005.
a. Reproduce the time plot with the overlaying MA(4) line.
b. What can we learn about the series from the MA line?
c. Run a moving average forecaster with adequate season length. Are forecasts generated by this method expected to over-forecast, under-forecast, or accurately forecast actual sales? Why?
Step by Step Answer:

This question has not been answered yet.
You can Ask your question!
Related Book For 

Machine Learning For Business Analytics
ISBN: 9781119828792
1st Edition
Authors: Galit Shmueli, Peter C. Bruce, Amit V. Deokar, Nitin R. Patel
Question Posted:
