

Toys R US Revenues. Figure 18 . 23 is a time plot of the quarterly revenues of
Question:
Toys “R” US Revenues. Figure 18 . 23 is a time plot of the quarterly revenues of Toys “R” US between 1992 and 1995 (thanks to Chris Albright for suggesting the use of these data, which are available in ToysRUsRevenues.csv). 12
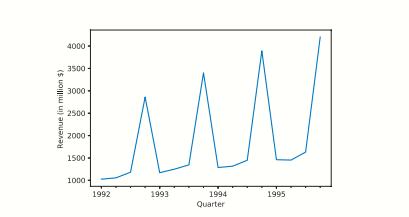
a. Fit a regression model with a linear trend and additive seasonality. Use the entire series (excluding the last two quarters) as the training set.
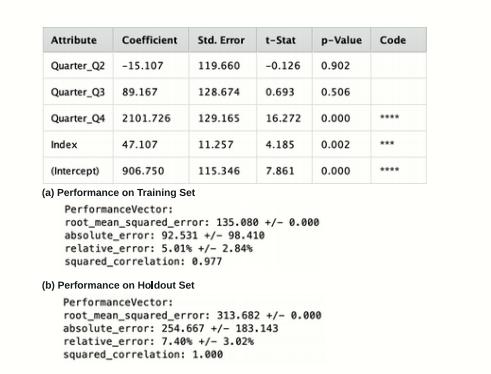
b. A partial output of the regression model is shown in Figure 18 . 24 (where Quarter_2 is the Quarter 2 dummy and Index is the trend). Use this output to answer the following questions:
i. Which two statistics (and their values) measure how well this model fits the training data?
ii. Which two statistics (and their values) measure the predictive accuracy of this model?
iii. After adjusting for trend, what is the average difference between sales in Q3 and sales in Q1?
iv. After adjusting for seasonality, which quarter (Q1, Q2, Q3, or Q4) has the highest average sales?
12Note: To parse the time attribute in RapidMiner as Date type, first use the Split operator to split the QuarterYear attribute values into quarter and year parts, and then use the Map operator to replace the quarters with months (e.g., replace Q1 with Mar). Next, use the Generate Attributes to combine them again using the concat function, and finally parse them as Date type with Nominal to Date operator
Step by Step Answer:

This question has not been answered yet.
You can Ask your question!


Machine Learning For Business Analytics
ISBN: 9781119828792
1st Edition
Authors: Galit Shmueli, Peter C. Bruce, Amit V. Deokar, Nitin R. Patel
