

In Figure 13-5 the temperature dependence of the standard molar entropy for chloroform is plotted. (a) Explain
Question:
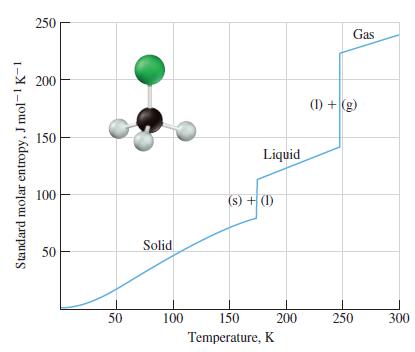
In Figure 13-5 the temperature dependence of the standard molar entropy for chloroform is plotted.
(a) Explain why the slope for the standard molar entropy of the solid is greater than the slope for the standard molar entropy of the liquid, which is greater than the slope for the standard molar entropy of the gas.
(b) Explain why the change in the standard molar entropy from solid to liquid is smaller than that for the liquid to gas.
Figure 13-5
Fantastic news! We've Found the answer you've been seeking!
Step by Step Answer:
a Explanation of the slopes of the standard molar entropy of the solid liquid and gas phases of chloroform The slope of the standard molar entropy curve represents the change in entropy with temperatu...View the full answer

Answered By
RADHIKA MEENAKAR
I am a qualified indian Company Secretary along with Masters in finance with over 6 plus years of professional experience. Apart from this i am a certified accounts and finance tutor on many online platforms.
My Linkedin profile link is here https://www.linkedin.com/in/radhika-meenakar-88b9808a/
12+ Reviews
22+ Question Solved
Related Book For 

General Chemistry Principles And Modern Applications
ISBN: 9780132931281
11th Edition
Authors: Ralph Petrucci, Jeffry Madura, F. Herring, Carey Bissonnette
Question Posted:
