

Frequency tables, histograms, and the National Survey of Student Engagement: The National Survey of Student Engagement (NSSE)
Question:
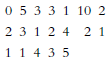
a. Create a frequency table for these data. Include a third column for percentages.
b. For what percentage of these schools did exactly 4% of the students report that they wrote between 5 and 10 twenty-page papers that year?
c. Is this a random sample? Explain your answer.
d. Create a histogram of grouped data, using six intervals.
e. In how many schools did 6% or more of the students report that they wrote between 5 and 10 twenty-page papers that year?
f. How are the data distributed?
Fantastic news! We've Found the answer you've been seeking!
Step by Step Answer:
a b In 1053 of these schools exactly 4 of the students reported that they wrote between 5 a...View the full answer

Answered By
John Aketch
I have a 10 years tutoring experience and I have helped thousands of students to accomplish their educational endeavors globally. What interests me most is when I see my students being succeeding in their classwork. I am confident that I will bring a great change to thins organization if granted the opportunity. Thanks
8+ Reviews
18+ Question Solved
Related Book For 

Essentials Of Statistics For The Behavioral Sciences
ISBN: 9781464107771
3rd Edition
Authors: Susan A. Nolan
Question Posted:
