

Frequency tables, histograms, and the Survey of Earned Doctorates: The Survey of Earned Doctorates regularly assesses the
Question:
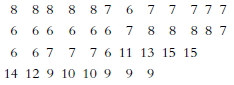
a. Create a frequency table for these data.
b. How many schools have an average completion time of 8 years or less?
c. Is a grouped fr equency table necessary? Why or why not?
d. Describe how these data are distributed.
e. Create a histogram for these data.
f. At how many universities did students take, on average, 10 or more years to complete their doctorates?
Fantastic news! We've Found the answer you've been seeking!
Step by Step Answer:
a b 30 c A grouped frequency table is not necessary here These data are relatively easy to ...View the full answer

Answered By
Susan Juma
I'm available and reachable 24/7. I have high experience in helping students with their assignments, proposals, and dissertations. Most importantly, I'm a professional accountant and I can handle all kinds of accounting and finance problems.
15+ Reviews
45+ Question Solved
Related Book For 

Essentials Of Statistics For The Behavioral Sciences
ISBN: 9781464107771
3rd Edition
Authors: Susan A. Nolan
Question Posted:
