

Here are the numbers of wins for the 30 National Basketball Association teams in the 20122013 season.
Question:
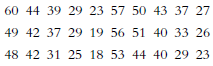
a. Create a grouped frequency table for these data.
b. Create a histogram based on the grouped frequency table.
c. Determine the mean, median, and mode of these data. Use symbols and the formula when showing your calculation of the mean.
d. Using software, calculate the range and standard deviation of these data.
e. Write a one- to two-paragraph summary describing the distribution of these data. Mention center, variability, and shape. Be sure to discuss the number of modes (i.e., unimodal, bimodal, multimodal), any possible outliers, an d the presence and direction of any skew.
f. State one research question that might arise from this data set.
DistributionThe word "distribution" has several meanings in the financial world, most of them pertaining to the payment of assets from a fund, account, or individual security to an investor or beneficiary. Retirement account distributions are among the most...
Fantastic news! We've Found the answer you've been seeking!
Step by Step Answer:
a b c With 30 scores the median would be between the 15th and 1...View the full answer

Answered By
Muhammad Umair
I have done job as Embedded System Engineer for just four months but after it i have decided to open my own lab and to work on projects that i can launch my own product in market. I work on different softwares like Proteus, Mikroc to program Embedded Systems. My basic work is on Embedded Systems. I have skills in Autocad, Proteus, C++, C programming and i love to share these skills to other to enhance my knowledge too.
1+ Reviews
10+ Question Solved
Related Book For 

Essentials Of Statistics For The Behavioral Sciences
ISBN: 9781464107771
3rd Edition
Authors: Susan A. Nolan
Question Posted:
