

The YerkesDodson graph demonstrates that graphs can be used to describe theoretical relations that can be tested.
Question:
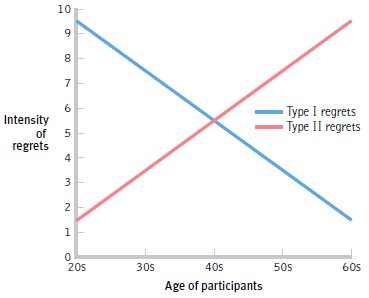
a. Briefly summarize the theoretical relations proposed by the graph.
b. What are the independent and dependent variables depicted in the graph? What kind of variables are they? If nominal or ordinal, what are the levels?
c. What descriptive statistics are incl uded in the text or on the graph?
d. In one or two sen tences, what story is the graph trying to tell?
Fantastic news! We've Found the answer you've been seeking!
Step by Step Answer:
a The graph proposes that Type I regrets of action are initially intense but ...View the full answer

Answered By
Bhartendu Goyal
Professional, Experienced, and Expert tutor who will provide speedy and to-the-point solutions. I have been teaching students for 5 years now in different subjects and it's truly been one of the most rewarding experiences of my life. I have also done one-to-one tutoring with 100+ students and help them achieve great subject knowledge. I have expertise in computer subjects like C++, C, Java, and Python programming and other computer Science related fields. Many of my student's parents message me that your lessons improved their children's grades and this is the best only thing you want as a tea...
2+ Reviews
10+ Question Solved
Related Book For 

Essentials Of Statistics For The Behavioral Sciences
ISBN: 9781464107771
3rd Edition
Authors: Susan A. Nolan
Question Posted:
