New Semester
Started
Get
50% OFF
Study Help!
--h --m --s
Claim Now
Question Answers
Textbooks
Find textbooks, questions and answers
Oops, something went wrong!
Change your search query and then try again
S
Books
FREE
Study Help
Expert Questions
Accounting
General Management
Mathematics
Finance
Organizational Behaviour
Law
Physics
Operating System
Management Leadership
Sociology
Programming
Marketing
Database
Computer Network
Economics
Textbooks Solutions
Accounting
Managerial Accounting
Management Leadership
Cost Accounting
Statistics
Business Law
Corporate Finance
Finance
Economics
Auditing
Tutors
Online Tutors
Find a Tutor
Hire a Tutor
Become a Tutor
AI Tutor
AI Study Planner
NEW
Sell Books
Search
Search
Sign In
Register
study help
mathematics
applied calculus
Calculus And Its Applications 14th Edition Larry Goldstein, David Lay, David Schneider, Nakhle Asmar - Solutions
Properties of various functions are described next. In each case, draw some conclusion about the graph of the function. g(5) = −1, g'(5) = −2, g″(5) = 0
Sketch the graphs of the following functions. zxz - gx4 = (x) f
For what x does the functionhave its maximum value? f(x) = x² − x + 2, 0 ≤ x ≤ 8,
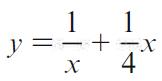
Sketch the graphs of the following functions for x > 0. y X 1 + -X 4
Each of the graphs of the functions in Exercises has one relative maximum and one relative minimum point. Plot these two points and check the concavity there. Using only this information, sketch the graph. f(x) = − 3x³ + 2x² - 12
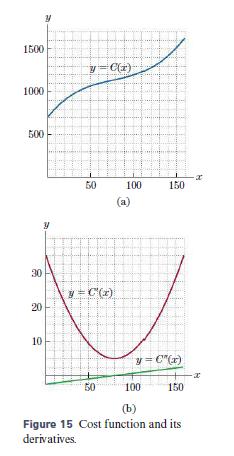
The cost function for a manufacturer is C(x) dollars, where x is the number of units of goods produced and C, C′, and C″ are the functions given in Fig. 15.(a) What is the cost of manufacturing 60 units of goods?(b) What is the marginal cost when 40 units of goods are manufactured?(c) At what
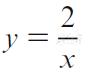
Sketch the graphs of the following functions for x > 0. y 2 X
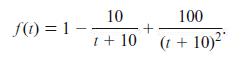
Let f (t) be the amount of oxygen (in suitable units) in a lake t days after sewage is dumped into the lake, and suppose that f (t) is given approximately byAt what time is the oxygen content increasing the fastest? f(1) = 1 10 1 + 10 + 100 (t+10)²
Draw the graph of a function y = f(x) with the stated properties.Both the function and the slope decrease as x increases.
Each of the graphs of the functions in Exercises has one relative maximum and one relative minimum point. Plot these two points and check the concavity there. Using only this information, sketch the graph. f(x) = x³ + 2x² - 5x + ¾/ 13 8
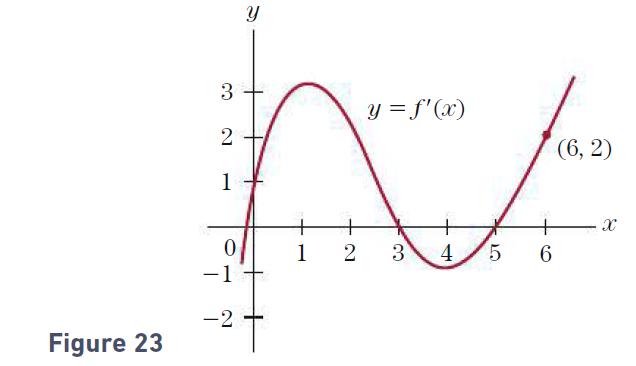
Refer to Fig. 23, which contains the graph of f′(x), the derivative of the function f (x).Explain why f(x) must be increasing at x = 6. Figure 23 3 2 1 10 -1 -2 y y = f'(x) 1 2 3 4 5 (6,2) + 6 X
The annual world consumption of oil rises each year. Furthermore, the amount of the annual increase in oil consumption is also rising each year. Sketch a graph that could represent the annual world consumption of oil.
Sketch the following parabolas. Include their x- and y-intercepts.y = 3 - x2
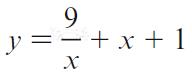
Sketch the graphs of the following functions for x > 0. y 9 ==+x+1 X
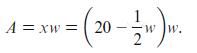
In Example 3 we can solve the constraint equation (2) for x instead of w to get x = 20 - 1/2 w. Substituting this for x in (1), we getSketch the graph of the equationand show that the maximum occurs when w = 20 and x = 10. = (20 - -/WW. A = xw =
The daily output of a coal mine after t hours of operation is approximately 40t + t2 - 1/15t3 tons, 0 ≤ t ≤ 12. Find the maximum rate of output (in tons of coal per hour).
In certain professions, the average annual income has been rising at an increasing rate. Let f (T) denote the average annual income at year T for persons in one of these professions and sketch a graph that could represent f (T).
Sketch the following parabolas. Include their x- and y-intercepts.y = 7 + 6x - x2
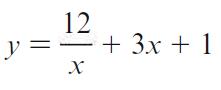
Sketch the graphs of the following functions for x > 0. 12 ==+3x+ 1 X y =
Sketch the following curves, indicating all relative extreme points and inflection points.y = x3 - 3x + 2
Refer to Fig. 23, which contains the graph of f′(x), the derivative of the function f (x).Explain why f (x) must be decreasing at x = 4. Figure 23 3 2 1 10 -1 -2 y y = f'(x) 1 2 3 4 5 (6,2) + 6 X
Consider a parabolic arch whose shape may be represented by the graph of y = 9 - x2, where the base of the arch lies on the x-axis from x = -3 to x = 3. Find the dimensions of the rectangular window of maximum area that can be constructed inside the arch.
Advertising for a certain product is terminated, and t weeks later, the weekly sales are f (t) cases, whereAt what time is the weekly sales amount falling the fastest? f(t) = 1000(1 + 8) 4000(+8)-².
At noon, a child’s temperature is 101°F and is rising at an increasing rate. At 1 p m. the child is given medicine. After 2 p m. the temperature is still increasing but at a decreasing rate. The temperature reaches a peak of 103°at 3 p m. and decreases to 100° by 5 p m. Draw a possible graph
Sketch the following parabolas. Include their x- and y-intercepts.y = x2 + 3x - 10
Sketch the graphs of the following functions for x > 0. y || + To N +2
Sketch the following curves, indicating all relative extreme points and inflection points.y = x3 - 6x2 + 9x + 3
Sketch the graphs of the following functions for x > 0. I + -12 y
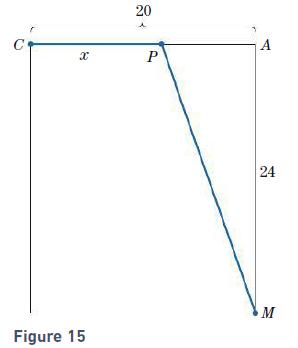
A cable is to be installed from one corner, C, of a rectangular factory to a machine, M, on the floor. The cable will run along one edge of the floor from C to a point, P, at a cost of $6 per meter, and then from P to M in a straight line buried under the floor at a cost of $10 per meter (see Fig.
A ship uses 5x2 dollars of fuel per hour when traveling at a speed of x miles per hour. The other expenses of operating the ship amount to $2000 per hour. What speed minimizes the cost of a 500-mile trip?
C(x) denote the total cost of manufacturing x units of some product. Then C(x) is an increasing function for all x. For small values of x, the rate of increase of C(x) decreases (because of the savings that are possible with “mass production”). Eventually, however, for large values of x, the
Sketch the following curves, indicating all relative extreme points and inflection points.y = 1 + 3x2 - x3
Sketch the following parabolas. Include their x- and y-intercepts.y = -2x2 + 10x - 10
One method of determining the level of blood flow through the brain requires the person to inhale air containing a fixed concentration of N2O, nitrous oxide. During the first minute, the concentration of N2O in the jugular vein grows at an increasing rate to a level of .25%. Thereafter, it grows at
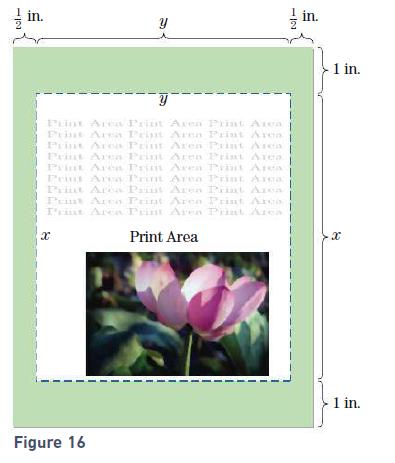
A rectangular page is to contain 50 square inches of print. The page has to have a 1-inch margin on top and at the bottom and a 1/2 -inch margin on each side (see Fig. 16). Find the dimensions of the page that minimize the amount of paper used. 12 in. y Print Area Print Aren Print Aren Print Area
Sketch the graphs of the following functions for x > 0. x= x^9 = A X
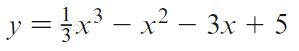
Sketch the following curves, indicating all relative extreme points and inflection points. y = x³ = x² − 3x + 5 -
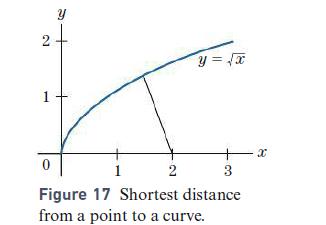
Find the point on the graph of y = √x that is closest to the point (2, 0). See Fig. 17. 2 1 0 Y 2 y = {x +x 3 1 Figure 17 Shortest distance from a point to a curve. 8
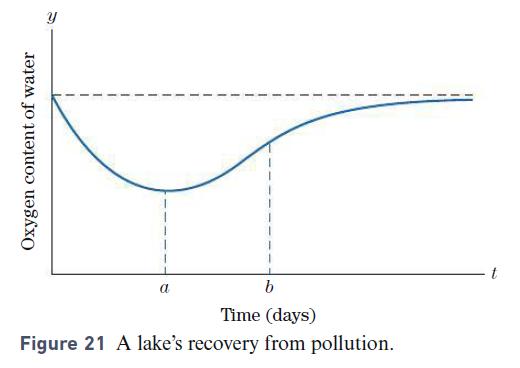
Suppose that some organic waste products are dumped into a lake at time t = 0 and that the oxygen content of the lake at time t is given by the graph in Fig. 21. Describe the graph in physical terms. Indicate the significance of the inflection point at t = b. Oxygen content of water y b Time
Sketch the following curves, indicating all relative extreme points and inflection points.y = -x3 + 12x - 4
If f(x) is defined on the interval 0 ≤ x ≤ 5 and f′(x) is negative for all x, for what value of x will f(x) have its greatest value? Explain why.
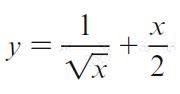
Sketch the graphs of the following functions for x > 0. y 1 Vx +
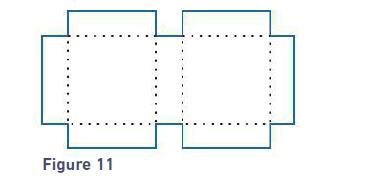
A pizza box is formed from a 20-cm by 40-cm rectangular piece of cardboard by cutting out six squares of equal size, three from each long side of the rectangle, and then folding the cardboard in the obvious manner to create a box. See Fig. 11. Let x be the length of each side of the six squares.
Sketch the following parabolas. Include their x- and y-intercepts.y = x2 - 9x + 19
Sketch the following curves, indicating all relative extreme points and inflection points. y=x4+1/383-2x^2 - x + 1 -
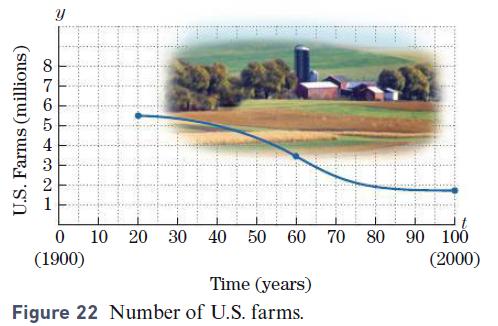
Figure 22 gives the number of U.S. farms in millions from 1920 (t = 20) to 2000 (t = 100). In what year was the number of farms decreasing most rapidly? U.S. Farms (millions) 87653 y 0 10 (1900) 20 30 40 50 60 70 80 Time (years) Figure 22 Number of U.S. farms. 90 100 100 (2000)
Refer to Fig. 23, which contains the graph of f′(x), the derivative of the function f (x).Explain why f (x) must be concave down at x = 2. Figure 23 3 2 1 10 -1 -2 y y = f'(x) 1 2 3 4 5 (6,2) + 6 X
Sketch the following parabolas. Include their x- and y-intercepts.y = x2 + 3x + 2
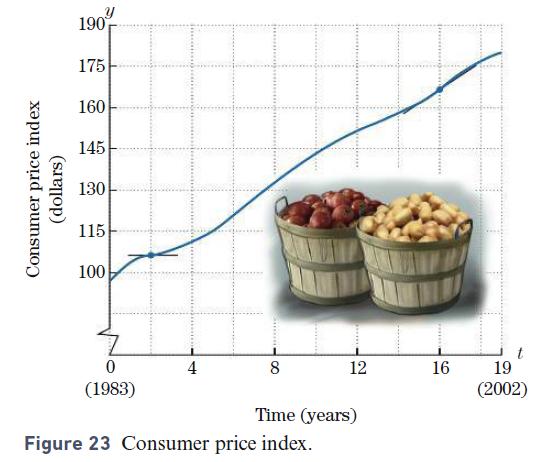
Figure 23 shows the graph of the consumer price index for the years 1983 (t = 0) through 2002 (t = 19). This index measures how much a basket of commodities that costs $100 in the beginning of 1983 would cost at any given time. In what year was the rate of increase of the index greatest? The least?
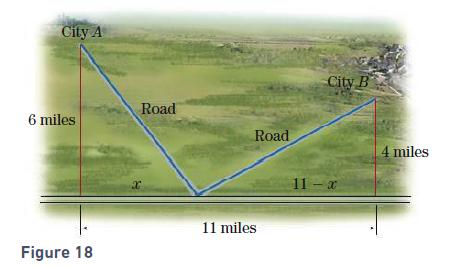
Find the point on the line y = -2x + 5 that is closest to the origin. City A 6 miles Figure 18 Road Road 11 miles City B 11-a 4 miles
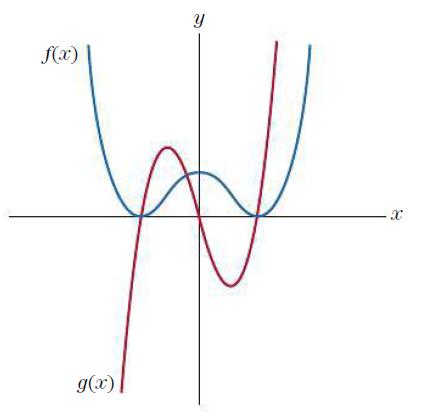
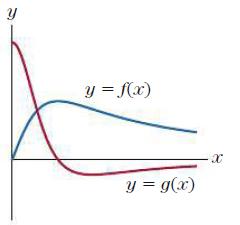
In Exercises, determine which function is the derivative of the other. f(x) g(x) Y X
Refer to Fig. 23, which contains the graph of f′(x), the derivative of the function f (x).Explain why f (x) has an inflection point at x = 1. Figure 23 3 2 1 10 -1 -2 y y = f'(x) 1 2 3 4 5 (6,2) + 6 X
Sketch the following parabolas. Include their x- and y-intercepts.y = -x2 + 8x - 13
Coffee consumption in the United States is greater on a per capita basis than anywhere else in the world. However, due to price fluctuations of coffee beans and worries over the health effects of caffeine, coffee consumption has varied considerably over the years. According to data published in The
Refer to Fig. 23, which contains the graph of f′(x), the derivative of the function f (x).Explain why f (x) has an inflection point at x = 4. Figure 23 3 2 1 10 -1 -2 y y = f'(x) 1 2 3 4 5 (6,2) + 6 X
In Exercises, determine which function is the derivative of the other. f(x) g(x) Y X
Sketch the following curves, indicating all relative extreme points and inflection points.y = 2x3 - 3x2 - 36x + 20
Refer to Fig. 23, which contains the graph of f′(x), the derivative of the function f (x).If f (6) = 3, what is the equation of the tangent line to the graph of y = f (x) at x = 6? Figure 23 3 2 1 10 -1 -2 y y = f'(x) 1 2 3 4 5 (6,2) + 6 X
Refer to Fig. 23, which contains the graph of f′(x), the derivative of the function f (x).If f (6) = 8, what is an approximate value of f (6.5)? Figure 23 3 2 1 10 -1 -2 y y = f'(x) 1 2 3 4 5 (6,2) + 6 X
Sketch the following curves, indicating all relative extreme points and inflection points. y = x² = x³
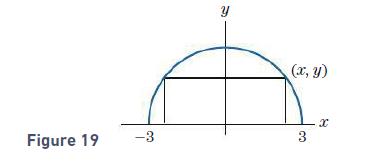
Find the value of x for which the rectangle inscribed in the semicircle of radius 3 in Fig. 19 has the greatest area. Figure 19 -3 Y (x, y) 3 X
Sketch the following parabolas. Include their x- and y-intercepts.y = -x2 + 20x - 90
Let s (t) be the distance (in feet) traveled by a parachutist after t seconds from the time of opening the chute, and suppose that s (t) has the line y = -15t + 10 as an asymptote. What does this imply about the velocity of the parachutist?
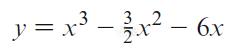
Sketch the following curves. y = x³ – ²x² - 6x
Sketch the following curves.y = 2x3 + 3x2 + 1
Sketch the following parabolas. Include their x- and y-intercepts.y = 2x2 + x - 1
Let a, b, c be fixed numbers with a ≠ 0, and let f(x) = ax2 + bx + c. Is it possible for the graph of f(x) to have an inflection point? Explain your answer.
Find the quadratic function f(x) = ax2 + bx + c that goes through (2, 0) and has a local maximum at (0, 1).
Sketch the graph of a function having the given properties.Defined for 0 ≤ x ≤ 10; relative maximum point at x = 3; absolute maximum value at x = 10
Let P(t) be the population of a bacteria culture after t days and suppose that P(t) has the line y = 25,000,000 as an asymptote. What does this imply about the size of the population?
Find the quadratic function f (x) = ax2 + bx + c that goes through (0, 1) and has a local minimum at (1,-1).
Let a, b, c, d be fixed numbers with a ≠ 0, and let f(x) = ax3 + bx2 + cx + d. Is it possible for the graph of f(x) to have more than one inflection point? Explain your answer.
Refer to Fig. 23, which contains the graph of f′(x), the derivative of the function f (x).If f (0) = 3, what is an approximate value of f (.25)? Figure 23 3 2 1 10 -1 -2 y y = f'(x) 1 2 3 4 5 (6,2) + 6 X
Sketch the graph of a function having the given properties.Relative maximum points at x = 1 and x = 5; relative minimum point at x = 3; inflection points at x = 2 and x = 4
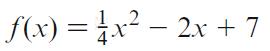
The graph of each function in Exercises has one relative extreme point. Find it (giving both x- and y-coordinates) and determine if it is a relative maximum or a relative minimum point. Do not include a sketch of the graph of the function. 2 f(x) = ¼x² − 2x + 7
Refer to Fig. 23, which contains the graph of f′(x), the derivative of the function f (x).If f (0) = 3, what is the equation of the tangent line to the graph of y = f (x) at x = 0? Figure 23 3 2 1 10 -1 -2 y y = f'(x) 1 2 3 4 5 (6,2) + 6 X
If f′(a) = 0 and f′(x) is increasing at x = a, explain why f(x) must have a local minimum at x = a.
Sketch the following curves. 2 1 1 y = ¹ + 3x − x² − 3x³ -
Sketch the following curves.y = x3 - 3x2 + 3x - 2
Sketch the graph of a function having the given properties.Defined and increasing for all x Ú 0; inflection point at x = 5; asymptotic to the line y = (3/4)x + 5
If f′(a) = 0 and f′(x) is decreasing at x = a, explain why f(x) must have a local maximum at x = a.
The graph of each function in Exercises has one relative extreme point. Find it (giving both x- and y-coordinates) and determine if it is a relative maximum or a relative minimum point. Do not include a sketch of the graph of the function.f(x) = 5 - 12x - 2x2
Sketch the following curves.y = 100 + 36x - 6x2 - x3
Sketch the graph of a function having the given properties.Defined for x Ú 0; absolute minimum value at x = 0; relative maximum point at x = 4; asymptotic to the line y = (x/2) + 1
In a medical experiment, the body weight of a baby rat in the control group after t days was f(t) = 4.96 + .48t + .17t2 - .0048t3 grams.(a) Graph f(t) in the window [0, 20] by [-12, 50].(b) Approximately how much did the rat weigh after 7 days?(c) Approximately when did the rat’s weight reach 27
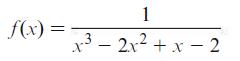
Graph the functionin the window [0, 4] by [-15, 15]. For what value of x does f(x) have a vertical asymptote? f(x) = 1 x32x²+x-2
The graph of each function in Exercises has one relative extreme point. Find it (giving both x- and y-coordinates) and determine if it is a relative maximum or a relative minimum point. Do not include a sketch of the graph of the function.g(x) = 3 + 4x - 2x2
Consider a smooth curve with no undefined points.(a) If it has two relative maximum points, must it have a relative minimum point?(b) If it has two relative extreme points, must it have an inflection point?
Sketch the following curves. y=-4r3 - 2,2 – 5 1.3 -
The canopy height (in meters) of the tropical bunch-grass elephant millet t days after mowing (for t ≥ 32) is f(t) = -3.14 + .142t - .0016t2 + .0000079t3 - .0000000133t4.(a) Graph f(t) in the window [32, 250] by [-1.2, 4.5].(b) How tall was the canopy after 100 days?(c) When was the canopy 2
The graph of each function in Exercises has one relative extreme point. Find it (giving both x- and y-coordinates) and determine if it is a relative maximum or a relative minimum point. Do not include a sketch of the graph of the function.g(x) = x2 + 10x + 10
Sketch the following curves.y = x3 - 3x2 - 9x + 7
If the function f (x) has a relative minimum at x = a and a relative maximum at x = b, must f (a) be less than f (b)?
The graph of each function in Exercises has one relative extreme point. Find it (giving both x- and y-coordinates) and determine if it is a relative maximum or a relative minimum point. Do not include a sketch of the graph of the function.f(x) = 5x2 + x - 3
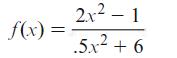
The graph of the functionhas a horizontal asymptote of the form y = c. Estimate the value of c by graphing f (x) in the window [0, 50] by [-1, 6]. f(x) = 2x² - 1 5,2+6
The graph of each function in Exercises has one relative extreme point. Find it (giving both x- and y-coordinates) and determine if it is a relative maximum or a relative minimum point. Do not include a sketch of the graph of the function.f(x) = 30x2 - 1800x + 29,000
Sketch the following curves.y = x3 - 6x2 - 15x + 50
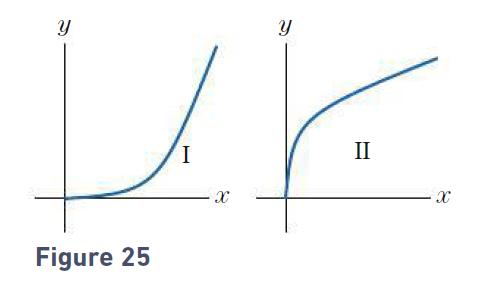
By looking at the second derivative, decide which of the curves in Fig. 25 could be the graph of f (x) = x5/2. ur I II Figure 25 - X
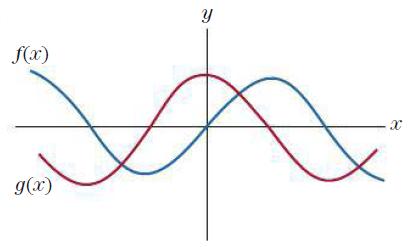
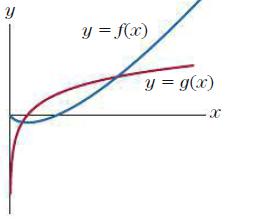
Determine which function is the derivative of the other. ບ y = f(x) y = g() X
Determine which function is the derivative of the other. y = f(x) y = g(x) X
Showing 4800 - 4900
of 5529
First
42
43
44
45
46
47
48
49
50
51
52
53
54
55
56
Step by Step Answers