New Semester
Started
Get
50% OFF
Study Help!
--h --m --s
Claim Now
Question Answers
Textbooks
Find textbooks, questions and answers
Oops, something went wrong!
Change your search query and then try again
S
Books
FREE
Study Help
Expert Questions
Accounting
General Management
Mathematics
Finance
Organizational Behaviour
Law
Physics
Operating System
Management Leadership
Sociology
Programming
Marketing
Database
Computer Network
Economics
Textbooks Solutions
Accounting
Managerial Accounting
Management Leadership
Cost Accounting
Statistics
Business Law
Corporate Finance
Finance
Economics
Auditing
Tutors
Online Tutors
Find a Tutor
Hire a Tutor
Become a Tutor
AI Tutor
AI Study Planner
NEW
Sell Books
Search
Search
Sign In
Register
study help
mathematics
business statistics
Introduction To Statistics And Data Analysis 6th Edition Roxy Peck, Chris Olsen, Tom Short - Solutions
At one point during the 2015 NFL season, head coach Bill Belichick and the New England Patriots had won 19 of their past 25 called coin flips at the beginning of NFL games (?For Bill Belichick, Patriots? Strategy Is No Flip of theCoin,? bostonglobe.com/sports/2015/11/04?
Data from a large study carried out in 2008 were used to estimate that 10% of all smokers who quit smoking are smoking again after 1 year (“Relapse to Smoking After 1 Year of Abstinence: A Meta-analysis,” ncbi.nlm.nih.gov/pmc/articles /PMC2577779/, June 8, 2008, retrieved May 6, 2017). The
A sample of dogs were trained using a ?Do as I do? method, in which the dog observes the trainer performing a simple task (such as climbing onto a chair or touching a chair) and is expected to perform the same task on the command ?Do it!? In a separate training session, the same dogs were trained
A study of hospitalized patients who develop pneumonia reported that 1 in 5 (20%) are readmitted to the hospital within 30 days after discharge (“Comparison of Therapist-Directed and Physician- Directed Respiratory Care in COPD Subjects with Acute Pneumonia,” Respiratory Care [2015]:
We are only beginning to learn about the longterm effects of space travel on human health. A study published in 2016 (Nature Scientific Reports 6,Article number: 29901, nature.com/articles? /srep29901, July 28, 2016, retrieved May 6, 2017) found that by 2014, seven of the U.S. astronauts who
Consider the water temperature situation described in the previous exercise. a. For the hypotheses and test procedure described in the previous exercise, calculate the value of b when ? = 153. b. For the hypotheses and test procedure described in the previous exercise, what is the value of b if ? =
The power of a test is influenced by the sample size and the choice of significance level.a. Explain how increasing the sample size affects the power (when significance level is held fixed).b. Explain how increasing the significance level affects the power (when sample size is held fixed).
In a study of media use, each person in a large representative sample of male Canadian high school students was asked how much time they spent playing video or computer games (in minutes per day). The sample mean was 123.4 minutes and the sample standard deviation was 117.1 minutes.a. Based on the
The authors of the paper “Changes in Quantity, Spending, and Nutritional Characteristics of Adult, Adolescent and Child Urban Corner Store Purchases After an Environmental Intervention” (Preventative Medicine [2015]: 81–85) wondered if increasing the availability of healthy food options would
The report “Majoring in Money: How American College Students Manage Their Finances” (Sallie Mae, 2016, news/salliemae.com, retrieved December 24, 2016) includes data from a survey of college students. Each person in a representative sample of 793 college students was asked if they had one or
The Economist collects data each year on the price of a Big Mac in various countries around the world. The price of a Big Mac for a sample of McDonald?s restaurants in Europe in July 2016 resulted in the following Big Mac prices (after conversion to U.S. dollars): The mean price of a Big Mac in
The report “2016 Salary Survey Executive Summary” (National Association of Colleges and Employers, naceweb.org/uploadedfiles/files/2016 /publications /executive summary/2016-nace-salary-survey-fall -executive-summary.pdf, retrieved December 24, 2016) states that the mean yearly salary offer for
The United States Elections Project (electproject .org/2016g, retrieved January 22, 2017) reported that 57.8% of registered voters in California voted in the 2016 presidential election and that this was less than the national percentage of 60.0%. Explain why it is not necessary to carry out a
The article “Public Acceptability in the UK and the USA of Nudging to Reduce Obesity: The Example of Reducing Sugar-Sweetened Beverages” (PLOS One, June 8, 2016) describes a survey in which each person in a representative sample of 1082 adult Americans was asked about whether they would find
The article “How to Block Nuisance Calls” (The Guardian, November 7, 2015) reported that in a survey of mobile phone users, 70% of those surveyed said they had received at least one nuisance call to their mobile phone in the last month. Suppose that this estimate was based on a representative
The report “Digital Democracy Survey” (DeloitteDevelopment LLC, 2016, deloitte.com/us/en .html, retrieved November 30, 2016) says that 69% of U.S. teens access the social media from a mobile phone. Suppose you plan to select a random sample of students at the local high school and will
The article “Euthanasia Still Acceptable to Solid Majority in U.S.” (gallup.com, June 24, 2016, retrieved November 29, 2016) summarized data from a survey of 1025 adult Americans. When asked if doctors should be able to end a terminally ill patient’s life by painless means if requested to do
In a survey conducted by CareerBuilder.com, employers were asked if they had ever fired an employee for shopping online while at work (“Cyber Monday Shopping at Work? You’re Not Alone,” November 22, 2016, retrieved November 30, 2016). Of the 2379 employers responding to the survey, 262 said
The article titled “13% of Americans Don’t Use the Internet. Who Are They?” describes a study conducted by the Pew Research Center (pewresearch.org, September 7, 2016, retrieved December 1, 2016). Suppose that the title of this article is based on a representative sample of 600 adult
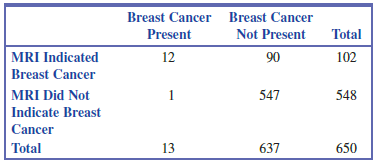
The paper ?Breast MRI as an Adjunct to Mammography for Breast Cancer Screening in High- Risk Patients? (American Journal of Roentgenology [2015]: 889?897) describes a study that investigated the usefulness of MRI (magnetic resonance imaging) to diagnose breast cancer. MRI exams from 650 women were
Researchers at Boston’s Children’s Hospital and Harvard Medical School analyzed records of breast cancer screening and diagnostic evaluations (National Expenditure for False-Positive Mammograms and Breast Cancer Overdiagnoses Estimated at $4 Billion a Year,” Health Affairs [2015]:576–583).
The article “Facebook Use and Academic Performance Among College Students,” Computers in Human Behavior [2015]: 265–272) estimated that 70 percent of students at a large public university in California who are Facebook users log into their Facebook profiles at least six times a day. Suppose
A cruise ship charges passengers $3 for a can of soda. Because of passenger complaints, the ship manager has decided to try out a plan with a lower price. He thinks that with a lower price, more cans will be sold, which would mean that the ship would still make a reasonable total profit. With the
A researcher speculates that because of differences in diet, Japanese children may have a lower mean blood cholesterol level than U.S. children do. Suppose that the mean level for U.S. children is known to be 170. Let µ represent the mean blood cholesterol level for all Japanese children. What
A national survey of 1012 adult Americans conducted by Gallup (“Americans Still Generally Upbeat About Personal Finances,” gallup.com, January 25, 2016, retrieved November 16, 2016) asked survey participants if they thought they were in better financial shape than they were 1 year ago. Suppose
CareerBuilder.com conducted a survey to learn about the proportion of employers who perform background checks when evaluating a job candidate (“Majority of Employers Background Check Employees . . . Here’s Why,” November 17, 2016, retrieved November 19, 2016). Suppose you are interested in
A press release about a paper that appeared in The Journal of Youth and Adolescence (springer.com /about+springer/media/springer+select?SGW ID=0-11001-6-1433942-0, August 26, 2013, retrieved May 8, 2017) was titled “Video Games Do Not Make Vulnerable Teens More Violent.” The press release
According to an article in Science Daily (“Still No Strong Evidence That Adjunct Treatment with HGH in IVF Improves Results,” sciencedaily.com, July 4, 2016, retrieved November 26, 2016), women who are having difficulty becoming pregnant sometimes use human growth hormone (HGH) in addition to
Explain why the statement x = 50 is not a legitimate hypothesis.
The report referenced in the previous exercise also indicated that 33% of those in a representative sample of 533 homeowners in southern states said that they had considered installing solar panels. a. Use the given information to construct and interpret a 90% confidence interval for the
The report “The Politics of Climate” (Pew Research Center, October 4, 2016, pewinternet .org/2016/10/04/the-politics-of-climate) summarized data from a survey on public opinion of renewable and other energy sources. It was reported that 52% of the people in a sample from western states said
The report “The 2016 Consumer Financial Literacy Survey” (The National Foundation for Credit Counseling, nfcc.org, retrieved October 28, 2016) summarized data from a representative sample of 1668 adult Americans. Based on data from this sample, it was reported that over half of U.S. adults
The article referenced in the previous exercise also indicated that 811 of the 1001 students surveyed said that they would feel restricted if they could only work on digital devices. Would a 95% confidence interval for the proportion of students age 13 to 19 who would say that they would feel
The article “Write It by Hand to Make It Stick” (Advertising Age, July 27, 2016) summarizes data from a survey of 1001 students age 13 to 19. Of the students surveyed, 851 reported that they learn best using a mix of digital and nondigital tools. Construct and interpret a 95% confidence
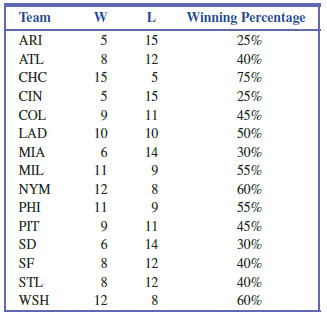
Major League Baseball (MLB) includes two groups of teams, in ?leagues.? There are 15 teams in each of the American League (AL) and the National League (NL). Since 1997, teams in each of the leagues play teams from the other league in ?interleague? regular-season games. One way to determine whether
The Economist collects data each year on the price of a Big Mac in various countries around the world. A sample of McDonald?s restaurants in Europe in 2016 resulted in the following Big Mac prices (after conversion to U.S. dollars): a. What characteristic of the sample indicates that the methods
Consumer Reports provides ratings for televisions, including energy cost per year (consumerreports .org/products/lcd-led-oled-tvs/ratings-overview/, retrieved December 23, 2016). Energy cost data for a sample of 13 small televisions (29-inch and smaller) are displayed in the following table: Make
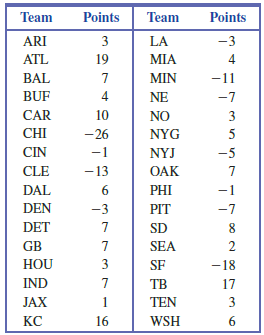
Teams in the National Football League (NFL) are given a ?bye? during one week of the season, when they can rest and not play a game. This may provide an advantage for the team in the next game they play after a bye. In 2016, each of the 32 NFL teams was granted a bye during one of the weeks of the
The authors of the paper ?Sex Differences in Time Perception During Smoking Abstinence? (Nicotine and Tobacco Research [2015]: 449?454) investigated how nicotine withdrawal affects time perception and decision making. In this study, 21 male smokers were asked to abstain from smoking for 24 hours.
Consumer Reports published the following gas mileage values (?Overall MPG?) for a sample of electric or plug-in hybrid car models (consumerreports .org/cro/cars/new-cars/hybrids-evs/ratings-reliability /ratings-overview.htm, retrieved December 23, 2016). Make and model ........................
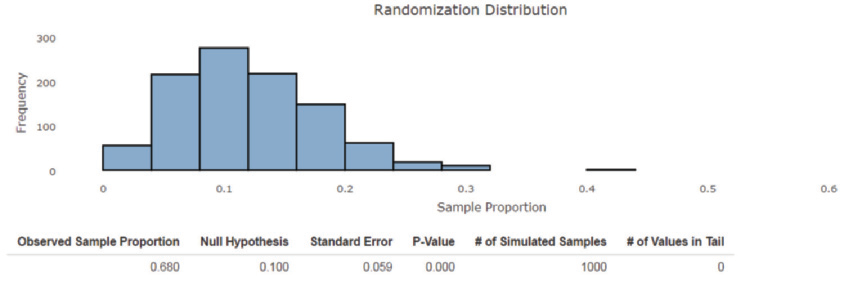
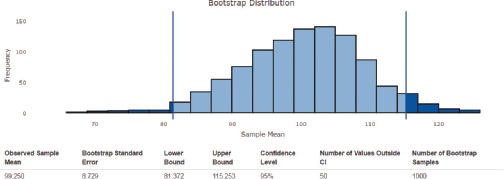
A 2016 study of 120 U.S. brand-name products found that 70% were active on Snapchat (businessinsider .com/what-exactly-are-brands-posting-on-snapchat -2016-6, June 15, 2016, retrieved May 4, 2017). The researchers conducting the study used bootstrap methods to determine a confidence interval.
The report “One in Three American Households Are Stuck in a Relationship with a Financial Services Provider They Don’t Trust” (businesswire.com/news /home/20160629005198/en/American-Households -Stuck-Relationship-Financial-Services-Provider, June 29, 2016, retrieved May 4, 2017) estimated
In mid-2016 the United Kingdom (UK) withdrew from the European Union (an event known as ?Brexit?), causing economic concerns throughout the world. One indicator that economists use to monitor the health of the economy is the proportion of residential properties offered for sale at auction that are
A survey of a representative sample of 478 U.S. employers determined that 359 ranked stress as their top health and productivity concern (globenewswire .com/news release/2016/06/29/852338/0/en /Seventy-five-percent-of-U-S-employers-say-stress -is-their-number-one-workplace-health-concern
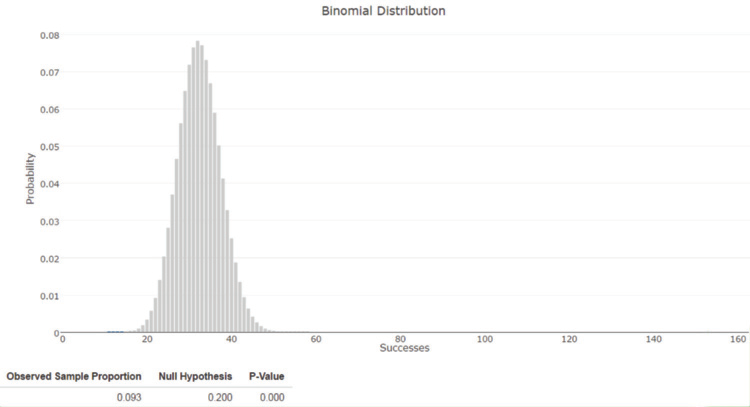
During the 2016 NBA Finals, Kevin Love of the Cleveland Cavaliers successfully made 5 three-point shots out of 19 attempts. Assume that these attempts comprise a sample that is representative of his ability during the entire 2016 season.a. Explain why it would not be appropriate to use a
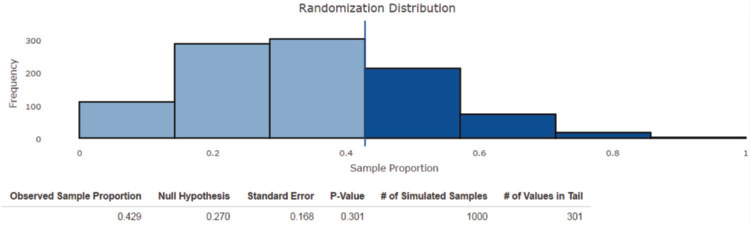
An article titled “The Latest on Workplace Monitoring and Surveillance” (American Management Association, November 17, 2014) referred to the “2007 Electronic Monitoring & Surveillance Survey.” In a summary of survey results submitted by 304 U.S. businesses, 85 of these businesses had
The article ?Report: More Than Half of DC-Area Millennials Are Using Ride-Hailing Apps? (washingtonian.com/2016/06/23/report-half-dc -area-millennials-using-ride hailing-apps/, June 23, 2016, retrieved May 4, 2017) refers to a study summarizedat the following site: wbaresearch.com
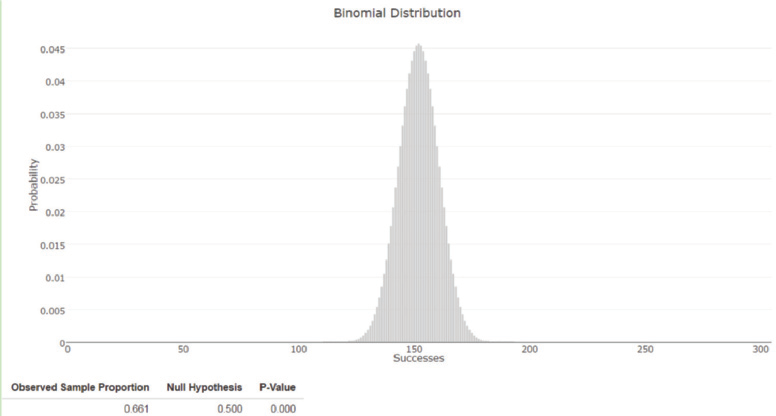
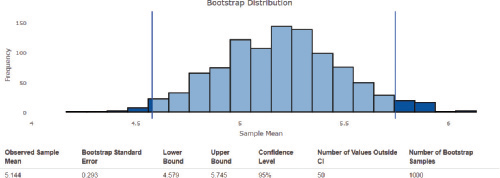
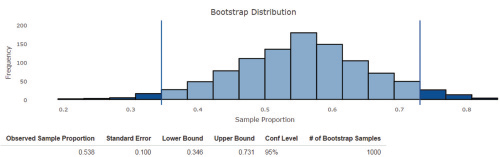
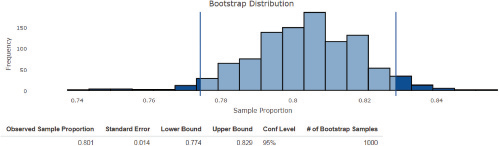
A survey on SodaHead (sodahead.com/survey /featured/anonymous-advice/?results=1, retrieved May 13, 2016) reported that 603 out of 753 respondents replied ?No? to the question ?Should You Be Friends with Your Boss on Facebook?? a. Use the accompanying output from the ?Bootstrap Confidence Interval
Consumer Reports gave the following mileage ratings (in miles per gallon) for seven midsize hybrid 2016 model cars (consumerreports.org/cro/cars /new-cars/hybrids evs/ratings-reliability/ratings -overview.htm, retrieved December 21, 2016). Is it reasonable to use these data and the t confidence
The authors of the paper “Driving Performance While Using a Mobile Phone: A Simulation Study of Greek Professional Drivers” (Transportation Research Part F [2016]: 164–170) describe a study to evaluate the effect of mobile phone use by taxi drivers in Greece. Fifty taxi drivers drove in a
The paper referenced in the previous exercise also reported that for a representative sample of 68 second-year students at the university, the sample mean procrastination score was 41.0 and the sample standard deviation was 6.82.a. Construct a 95% confidence interval estimate of m, the population
Students in a representative sample of 65 first-year students selected from a large university in England participated in a study of academic procrastination (“Study Goals and Procrastination Tendencies a Different Stages of the Undergraduate Degree,” Studies in Higher Education [2016]:
The paper “The Effects of Adolescent Volunteer Activities on the Perception of Local Society and Community Spirit Mediated by Self-Conception” (Advanced Science and Technology Letters [2016]: 19–23) describes a survey of a large representative sample of middle school children in South
USA TODAY reported that the average amount of money spent on coffee drinks each month is $78.00 (USA TODAY Snapshot, November 4, 2016).a. Suppose that this estimate was based on a representative sample of 20 adult Americans. Would you recommend using the one-sample t confidence interval to estimate
In 2010, the online security firm Symantec estimated that 63% of computer users don’t change their passwords very often (cnet.com/news/survey-63-dont -change passwords-very-often, retrieved November 19, 2016). Suppose that you want to carry out a new survey to estimate the proportion of students
Based on survey of a representative sample of 1000 adult Americans, YouGov estimated that the proportion of adult Americans who have less than $1000 in savings is 0.430 (“People More Likely to Save with an Opt-Out System,” today.yougov.com /news/2016/04/25/savings/). The margin of error
The article “Most Americans Don’t Understand the Cloud, But They Should” (foxbusiness.com, October 17, 2016, retrieved November 12, 2016) reported that in a sample of 1000 people, 22% said they have pretended to know what the cloud is or how it works. If it is reasonable to regard the sample
In 2010, the National Football League adopted new rules designed to limit head injuries. In a survey conducted in 2015 by the Harris Poll, 1216 of 2096 adults indicated that they were football fans and followed professional football. Of those who were football fans, 692 said they thought that the
Business Insider reported that a study commissioned by eBay motors found that nearly 40% of millennials who drive a car that is more than 5 years old have named their cars (“Millennials Have an Odd Habit When It Comes to Their Cars,” April 14, 2016). Suppose that this statement was based on a
Each person in a random sample of 20 students at a particular university was asked whether he or she is registered to vote. The responses (R = registered, N = not registered) are given here:R R N R N N R R R N R R R R R N R R R NUse these data to estimate p, the proportion of all students at the
The USA TODAY Snapshot titled “Have a Nice Trip” (USA TODAY, November 17, 2015) summarized data from a survey of 1000 U.S. adults who had traveled by air at least once in the previous year. The Snapshot includes the following statement: “38% admit to yelling at a complete stranger while
USA TODAY reported that the proportion of Americans who prefer cheese on their burgers is 0.84 (USA TODAY, September 7, 2016). This estimate was based on a survey of a representative sample of 1000 adult Americans. Calculate and interpret a 90% confidence interval for the proportion of Americans
The report “Job Seeker Nation Study 2016” (jobvite .com/wp-content/uploads/2016/03/Jobvite _Jobseeker_Nation_2016.pdf, retrieved May 6, 2017) summarized a survey of 2305 working adults. The report indicates that 484 of the working adults surveyed said they were very concerned that their job
The USA TODAY Snapshot titled “Baby’s First Photo Reveal” (USA TODAY, October 17, 2014) summarized data from a survey of 1001 mothers with children under the age of 2. The Snapshot includes the following statement: “83% of moms post new baby photos from the delivery room.” This
The Princeton Review 2016 College Hopes and Worries Survey Report (princetonreview.com/cms -content/final_cohowo2016survrpt.pdf, retrieved May 6, 2017) reported that 31% of students applying to college wanted to attend a college that was within 250 miles of their home and that 51% of parents of
The article “Most Dog Owners Take More Pictures of Their Pet Than Their Spouse” (August 22,2016, news.fastcompany.com/most-dog-owners -take-more-pictures-of their-pet-than-their -spouse-4017458, retrieved May 6, 2017) indicates that in a sample of 1000 dog owners, 650 said that they take
The USA TODAY Snapshot titled “Big Bang Theory” (USA TODAY, October 14, 2016) summarized data from a sample of 1003 American parents of children age 6 to 11. It reported that 53% of these parents view science-oriented TV shows as a good way to expose their children to science outside of school.
The report “Parents, Teens and Digital Monitoring” (Pew Research Center, January 7, 2016, pewinternet.org/2016/01/07/parents-teens-and-digital -monitoring, retrieved April 4, 2018) reported that 61% of parents of teens age 13 to 17 said that they had checked which web sites their teens
The USA TODAY Snapshot titled “Social Media Jeopardizing Your Job?” (USA TODAY, November 12, 2014) summarized data from a survey of 1855 recruiters and human resource professionals. The Snapshot indicated that 53% of the people surveyed had reconsidered a job candidate based on his or her
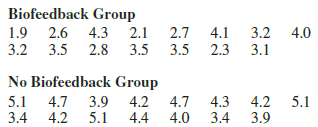
The authors of the paper ?Influence of Biofeedback Weight Bearing Training in Sit to Stand to Sit and the Limits of Stability on Stroke Patients? (The Journal of Physical Therapy Science [2016]: 3011?2014) randomly selected two samples of patients admitted to the hospital after suffering a stroke.
The report “The 2016 Consumer Financial Literacy Survey” (The National Foundation for Credit Counseling (nfcc.org, retrieved October 28, 2016) summarized data from a representative sample of 1668 adult Americans. When asked if they typically carry a credit card debt from month to month, 584 of
Let x1, x2, . . . , x100 denote the actual weights (in pounds) of 100 randomly selected bags of fertilizer. Suppose that the weight of a randomly selected bag has a distribution with mean 50 pounds and variance 1 pound2. Let x̅ be the sample mean weight (n = 100).a. Describe the sampling
The article “Fewer Americans Are Reading, But Don’t Blame the Millennials” (Los Angeles Times, October 9, 2016) indicates that 80% of millennials (those age 18 to 29) have read a book in the last year. Suppose that this is the actual percentage for the population of all millennials. Consider
The U.S. Census Bureau reported that in 2015, the proportion of adult Americans age 25 and older who have a bachelor’s degree or higher is 0.325 (“Educational Attainment in the United States: 2015,” census.gov, retrieved January 22, 2017). Consider the population of all adult Americans age 25
The thickness (in millimeters) of the coating applied to hard drives is one characteristic that determines the usefulness of the product. When no unusual circumstances are present, the thickness (x) has a normal distribution with a mean of 2 mm and a standard deviation of 0.05 mm. Suppose that the
Kyle and Lygia are going to play a series of Trivial Pursuit games. The first person to win four games will be declared the winner. Suppose that outcomes of successive games are independent and that the probability of Lygia winning any particular game is 0.6. Define a random variable x as the
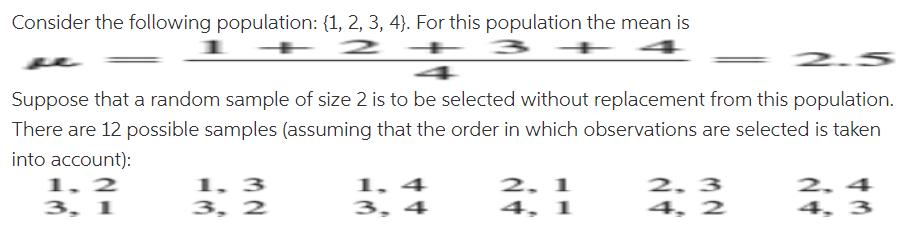
Simulate sampling from the population of Exercise 8.7 by using four slips of paper individually marked 1, 2, 3, and 4. Select a sample of size 2 without replacement, and calculate x. Repeat this process 50 times, and construct a density histogram of the 50 x?. values. How does this sampling
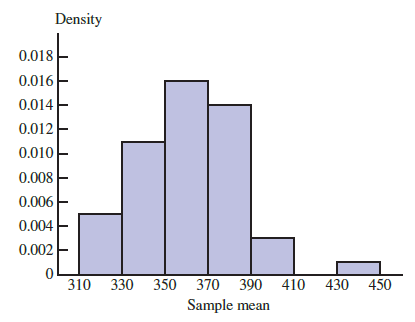
Select 10 additional random samples of size 5 from the population of 20 students given in Example 8.1, and calculate the mean amount spent on books for each of the 10 samples. Are the x? values consistent with the results of the sampling experiment summarized in Figure 8.1? Density 0.018 0.016
Consider a population consisting of the following five values, which represent the number of video downloads during the academic year for each of five housemates:8 14 16 10 11Compute the mean of this population.
Suppose there are approximately 40,000 travel agencies in the United States, of which 11,000 are members of the American Society of Travel Agents (ASTA).a. If x is the number of ASTA members among 5000 randomly selected agencies, could you use the methods of Section 7.8 to approximate P(1200 < x
Four people—a, b, c, and d—are waiting to give blood. Of these four, a and b have type AB blood, whereas c and d do not. An emergency call has just come in for some type AB blood. If blood donations are taken one by one from the four people in random order and x is the number of donations
Flashlight bulbs manufactured by a certain company are sometimes defective.a. If 5% of all such bulbs are defective, could the techniques of this section be used to approximate the probability that at least five of the bulbs in a random sample of size 50 are defective?If so, calculate this
Consider the information on the MENT test given in the previous exercise.a. The exact binomial probability of a score of 42 or less for someone who is not faking the test (p = 0.96) isp(x ≤ 42) = 0.000000000013Explain why this probability was calculated using the binomial formula rather than
Symptom validity tests (SVTs) are sometimes used to confirm diagnosis of psychiatric disorders. The paper “Developing a Symptom Validity Test for Post-Traumatic Stress Disorder: Application of the Binomial Distribution” (Journal of Anxiety Disorders [2008]: 1297–1302) investigated the use of
For the binomial distribution described in the previous exercise, approximate the following probabilities using the normal approximation with the continuity correction.a. P(25 ≤ x ≤ 40)b. P(25 < x < 40) (25 < x < 40 is the same as 26 ≤ x ≤ 39.)
Suppose that x has a binomial distribution with n = 50 and p = 0.6, so that µ = np = 30 and σ = √np(1 - p) = 3.464. Approximate the following probabilities using the normal approximation with the continuity correction. See Example 7.35.a. P(x = 30)b. P(x = 25)c. P(x ≤ 25)
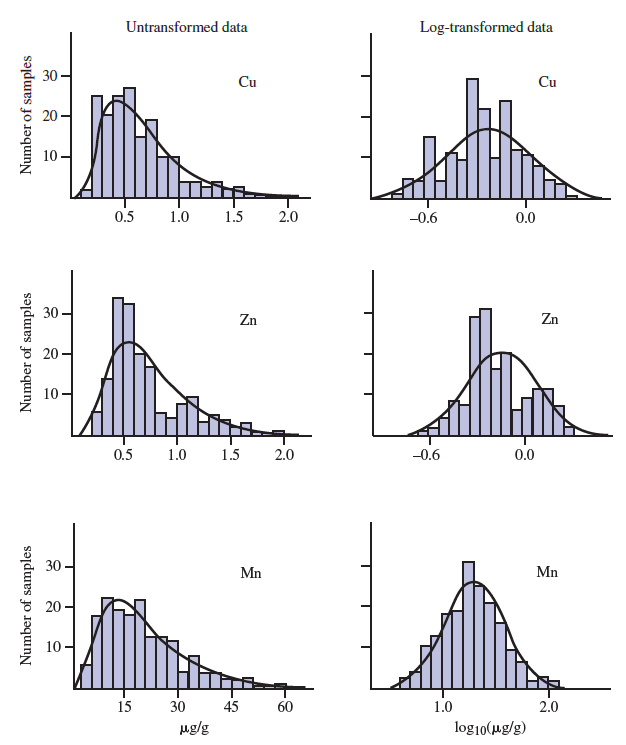
The figure on the next page appeared in the paper ?EDTA-Extractable Copper, Zinc, and Manganese in Soils of the Canterbury Plains? (New Zealand Journal of Agricultural Research [1984]: 207?217). A large number of topsoil samples were analyzed for manganese (Mn), zinc (Zn), and copper (Cu), and the
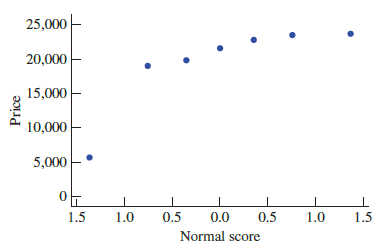
The following normal probability plot was constructed using data on the price of seven 2015 Honda Accords with automatic transmissions that were listed for sale within 25 miles of the zip code 19383 (from autotrader.com, search conducted on September 24, 2016). For purposes of this exercise, you
Purchases made at small “corner stores” were studied by the authors of the paper “Changes in Quantity, Spending, and Nutritional Characteristics of Adult, Adolescent and Child Urban Corner Store Purchases After an Environmental Intervention” (Preventive Medicine [2015]: 81–85). Corner
The article “New York City’s Graffiti-Removal Response Time Rises” (The Wall Street Journal,September 16, 2016, wsj.com/articles/new-york -citys-graffiti-removal response-time-rises -1473287392, retrieved May 1, 2017) states that the city took an average of 114 days to handle graffiti
Determine each of the following areas under the standard normal (z) curve:a. To the right of 0b. To the right of 25c. Between 21.6 and 2.5d. To the left of 0.23
Suppose that 90% of all registered California voters favor banning the release of information from exit polls in presidential elections until after the polls in California close. A random sample of 25 registered California voters is to be selected.a. What is the probability that more than 20 favor
Suppose that the probability is 0.1 that any given citrus tree will show measurable damage when the temperature falls to 308F.a. If the temperature does drop to 308F, what is the expected number of citrus trees showing damage in orchards of 2000 trees?b. What is the standard deviation of the number
Women’s Health Magazine surveyed 1187 readers to find out how often people wash their sheets (womenshealthmag.com/health/dirty-sheets, March 26, 2015, retrieved May 2, 2017). They found that even though microbiologists recommend that you wash your sheets at least once a week, only 44% said that
Information Security Buzz provides news for the information security community. In an article published on September 24, 2016, it reported that based on a large international survey of Internet users, 60% of Internet users have installed security solutions on all of the devices they use to access
CBS News reported that 4% of adult Americans have a food allergy (June 1, 2017, cbsnews.com /news/food-allergies-in-america-new-report -shellfish-peanut-dairy, retrieved March 25, 2018).Consider selecting 10 adult Americans at random.Define the random variable x asx = number of people in the sample
Consider the random variables xR and xB defined in the previous exercise.a. Suppose that you are offered a choice of the following two games:Game 1: Pay $7 to play, and you win y1 dollars, where y1 = xR + xB.Game 2: Doesn’t cost anything to play initially, but you “win” 3y2 dollars, where y2
Consider a game in which a red die and a blue die are rolled. Let xR denote the value showing on the uppermost face of the red die, and define xB similarly for the blue die. a. The probability distribution of xR is Find the mean, variance, and standard deviation of xR. b. What are the values of
A multiple-choice exam consists of 50 questions. Each question has five choices, of which only one is correct. Suppose that the total score on the exam is calculated as where x1 = number of correct responses and x2 = number of incorrect responses. (Calculating a total score by subtracting a term
To assemble a piece of furniture, a wood peg must be inserted into a predrilled hole. Suppose that the diameter of a randomly selected peg is a random variable with mean 0.25 inch and standard deviation 0.006 inch and that the diameter of a randomly selected hole is a random variable with mean
Showing 400 - 500
of 4119
1
2
3
4
5
6
7
8
9
10
11
12
13
14
15
Last
Step by Step Answers