New Semester
Started
Get
50% OFF
Study Help!
--h --m --s
Claim Now
Question Answers
Textbooks
Find textbooks, questions and answers
Oops, something went wrong!
Change your search query and then try again
S
Books
FREE
Study Help
Expert Questions
Accounting
General Management
Mathematics
Finance
Organizational Behaviour
Law
Physics
Operating System
Management Leadership
Sociology
Programming
Marketing
Database
Computer Network
Economics
Textbooks Solutions
Accounting
Managerial Accounting
Management Leadership
Cost Accounting
Statistics
Business Law
Corporate Finance
Finance
Economics
Auditing
Tutors
Online Tutors
Find a Tutor
Hire a Tutor
Become a Tutor
AI Tutor
AI Study Planner
NEW
Sell Books
Search
Search
Sign In
Register
study help
mathematics
college algebra graphs and models
College Algebra 7th Edition Robert F Blitzer - Solutions
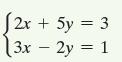
In Exercises 1–12, solve each system by the method of your choice. (2x + 5y = 3 (3x - 2y = 1
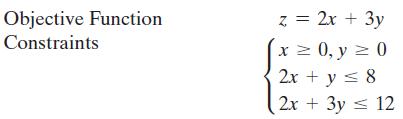
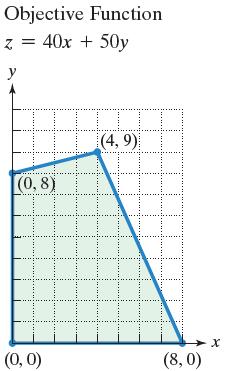
In Exercises 5–14, an objective function and a system of linear inequalities representing constraints are given.a. Graph the system of inequalities representing the constraints.b. Find the value of the objective function at each corner of the graphed region.c. Use the values in part (b) to
In Exercises 1–26, graph each inequality. VI y: 1 4 -X
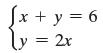
In Exercises 5–18, solve each system by the substitution method. √x + y = 6 = 2x
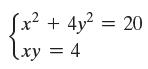
Fill in each blank so that the resulting statement is true.When solvingby the substitution method, we can eliminate y by solving the second equation for y. We obtain y =_______ . Then we substitute_________ for in the first equation. [x² + 4y² = 20 Lxy = 4
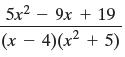
In Exercises 1–8, write the form of the partial fraction decomposition of the rational expression. It is not necessary to solve for the constants. 5x² - 9x + 19 (x-4)(x² + 5)
Fill in each blank so that the resulting statement is true.True or false: The graph of the linear equation 2x - 3y = 6 is used to graph the linear inequality 2x - 3y > 6._______
Fill in each blank so that the resulting statement is true.True or false: When graphing 4x - 2y ≥ 8, to determine which side of the line to shade, choose a test point on 4x - 2y = 8._______
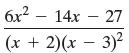
In Exercises 1–8, write the form of the partial fraction decomposition of the rational expression. It is not necessary to solve for the constants. 6x² - 14x - 27 (x + 2)(x - 3)²
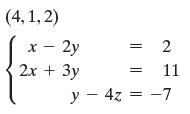
In Exercises 1–4, determine if the given ordered triple is a solution of the system. (4,1,2) X - 2y 2x + 3y 2 11 y - 4z = -7
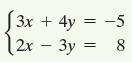
In Exercises 1–12, solve each system by the method of your choice. 3x + 4y 2х - Зу = = -5 UA 8
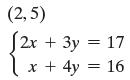
In Exercises 1–4, determine whether the given ordered pair is a solution of the system. (2,5) (2x + 3y + 3y = 17 x + 4y = 16
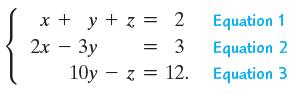
Fill in each blank so that the resulting statement is true.Consider the following system:Equation 2 does not contain the variable_______ . To obtain a second equation that does not contain this variable, we can_________ . x + y + z = 2 2x - 3y = = 3 10yz 12. Equation 1 Equation 2 Equation 3
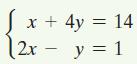
In Exercises 1–5, solve by the method of your choice. Identify systems with no solution and systems with infinitely many solutions, using set notation to express their solution sets. x + 4y = 14 [2x y = 1
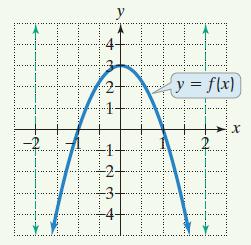
The figure shows the graph of y = f(x) and its two vertical asymptotes. Use the graph to solve Exercises 1–10.Find the zeros. 2 I 8996 y = f(x) 0000 X
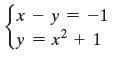
In Exercises 1–18, solve each system by the substitution method. Jx - y = -1 y = x² + 1
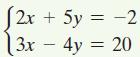
In Exercises 1–5, solve the system. (2x + 5y = -2 3x - 4y - 4y = 20
Fill in each blank so that the resulting statement is true.When solving a system of linear equations by graphing, the system’s solution is determined by locating___________ .
Determine whether each partial fraction decomposition is set up correctly. If the setup is incorrect, make the necessary changes to produce the correct decomposition.Correct or incorrect:______ . 1 (x + 1)(x² + 4) А x+1 + B x² + 4 2
Fill in each blank so that the resulting statement is true.A system of linear inequalities is used to represent restrictions, or__________ , on a function that must be maximized or minimized. Using the graph of such a system of inequalities, the maximum and minimum values of the function occur at
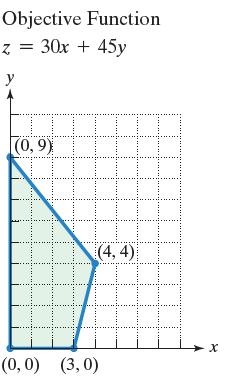
In Exercises 1–4, find the value of the objective function at each corner of the graphed region. What is the maximum value of the objective function? What is the minimum value of the objective function? Objective Function z = 30x + 45y (0,9) (4,4) (0,0) (3,0) HI X
In Exercises 1–26, graph each inequality. 2x - y > 4
Fill in each blank so that the resulting statement is true.True or false: The graph of 2x - 3y > 6 includes the line 2x - 3y = 6.________
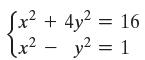
Fill in each blank so that the resulting statement is true.When solvingby the addition method, we obtain y2 = 3, so the solution set is________ . = [x2 + 4y2 = 16 x2 - y2 = 1
In Exercises 1–8, write the form of the partial fraction decomposition of the rational expression. It is not necessary to solve for the constants. 3x + 16 (x + 1)(x - 2)2
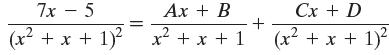
Determine whether each partial fraction decomposition is set up correctly. If the setup is incorrect, make the necessary changes to produce the correct decomposition.Correct or incorrect:______ . 7x - 5 (x² + x + 1)² Ax + B 2 x² + x + 1 + Cx + D (x² + x + 1)²
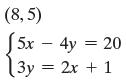
In Exercises 1–4, determine whether the given ordered pair is a solution of the system. (8,5) 5x - 4y = 20 Зу = 2x + 1
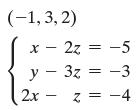
In Exercises 1–4, determine if the given ordered triple is a solution of the system. (-1,3,2) x 2z = -5 y 3z = -3 - 2x z z = -4
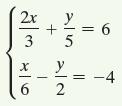
In Exercises 1–12, solve each system by the method of your choice. 2x 3 x 6 + У 5 y 2 || 6 -4
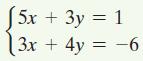
In Exercises 1–5, solve by the method of your choice. Identify systems with no solution and systems with infinitely many solutions, using set notation to express their solution sets. 5х + 3у = 1 3x + 4y || -6
The figure shows the graph of y = f(x) and its two vertical asymptotes. Use the graph to solve Exercises 1–10.What is the relative maximum and where does it occur? 2 I 8996 y = f(x) 0000 X
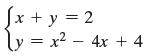
In Exercises 1–18, solve each system by the substitution method. (x + y = 2 ly = x² - 4x + 4
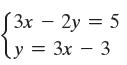
Fill in each blank so that the resulting statement is true.When solvingby the substitution method, we obtain x = 13 , so the solution set is__________ . 3x-2y = 5 = = 3x - 3
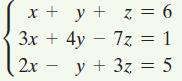
In Exercises 1–5, solve the system. x + y + z = 6 3x + 4y - 7z = 1 2x - y + 3z = 5
In Exercises 1–4, find the value of the objective function at each corner of the graphed region. What is the maximum value of the objective function? What is the minimum value of the objective function? Objective Function z = 40x + 50y y III (4,9) HI (0,8) H (0, 0) (8,0) X
In Exercises 1–26, graph each inequality. x - 2y > 10
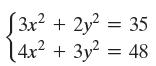
Fill in each blank so that the resulting statement is true.When solvingby the addition method, we can eliminate x2 by multiplying the first equation by -4 and the second equation by_______ and then adding the equations. [3x² + 2y² = 35 4x² + 3y² = 48
Fill in each blank so that the resulting statement is true.The set of all points on one side of a line is called a/an________ .
In Exercises 73–76, determine whether each statement makes sense or does not make sense, and explain your reasoning.Because carbon-14 decays exponentially, carbon dating can determine the ages of ancient fossils.
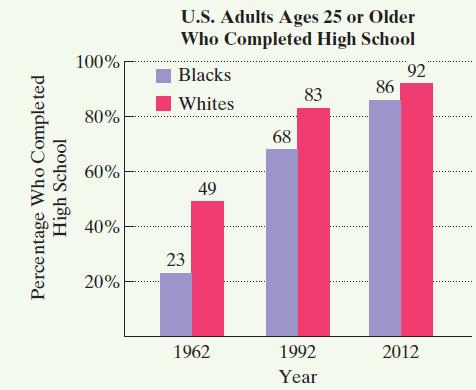
In 1954, the Supreme Court ended legal segregation in U.S. public schools. The bar graph shows the percentage of black and white U.S. adults ages 25 or older who completed high school since the end of segregation.The functions B(x) = 16 ln x + 23 and W(x) = 11 ln x + 49 model the percentage of
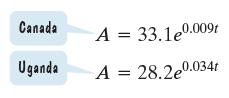
The exponential growth models describe the population of the indicated country, A, in millions, t years after 2006.In Exercises 77–80, use this information to determine whether each statement is true or false. If the statement is false, make the necessary change(s) to produce a true statement.The
Graph f(x) = 5x and g(x) = log5 x in the same rectangular coordinate system.
In Exercises 19–29, evaluate each expression without using a calculator. If evaluation is not possible, state the reason.log3 38
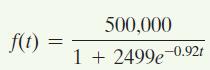
The functionmodels the number of people, f(t), in a city who have become ill with influenza t weeks after its initial outbreak.a. How many people became ill with the flu when the epidemic began?b. How many people were ill by the end of the sixth week?c. What is the limiting size of f(t), the
a. Graph y = ex and y = 1 + x + x2/2 in the same viewing rectangle.b. Graph y = ex and y = 1 + x + x2/2 + x3/6 in the same viewing rectangle.c. Graph y = ex and y = 1 + x + x2/2 + x3/6 + x4/24 in the same viewing rectangle.
The exponential growth models describe the population of the indicated country, A, in millions, t years after 2006.In Exercises 77–80, use this information to determine whether each statement is true or false. If the statement is false, make the necessary change(s) to produce a true
Would you prefer that your salary be modeled exponentially or logarithmically? Explain your answer.
One problem with all exponential growth models is that nothing can grow exponentially forever. Describe factors that might limit the size of a population.
In Exercises 73–76, determine whether each statement makes sense or does not make sense, and explain your reasoning.After 100 years, a population whose growth rate is 3% will have three times as many people as a population whose growth rate is 1%.
In Exercises 73–76, determine whether each statement makes sense or does not make sense, and explain your reasoning.When I used an exponential function to model Russia’s declining population, the growth rate k was negative.
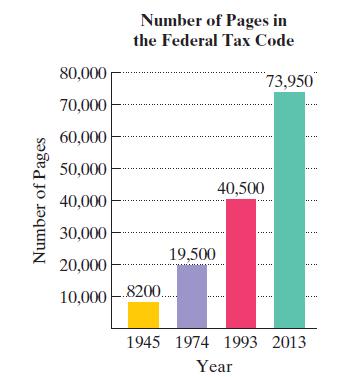
In Exercises 83–86, determine whether each statement makes sense or does not make sense, and explain your reasoning.Taxing thoughts: I’m looking at data that show the number of pages in the publication that explains the U.S. tax code for selected years from 1945 through 2013. A linear function
In Exercises 79–82, use a graphing utility and the change-of base property to graph each function.y = log3(x - 2)
Describe how you could use the graph of f(x) = 2x to obtain a decimal approximation for √2.
Solve each logarithmic equation in Exercises 49–92. Be sure to reject any value of x that is not in the domain of the original logarithmic expressions. Give the exact answer. Then, where necessary, use a calculator to obtain a decimal approximation, correct to two decimal places, for the
In Exercises 83–88, let logb 2 = A and logb 3 = C. Write each expression in terms of A and C. 3 logb 16
Each group member should consult an almanac, newspaper, magazine, or the Internet to find data that can be modeled by exponential or logarithmic functions. Group members should select the two sets of data that are most interesting and relevant. For each set selected, find a model that best fits the
In Exercises 83–86, determine whether each statement makes sense or does not make sense, and explain your reasoning.I’m using a photocopier to reduce an image over and over by 50%, so the exponential function f(x) = (1/2)x models the new image size, where x is the number of reductions.
In Exercises 83–86, determine whether each statement makes sense or does not make sense, and explain your reasoning.I use the natural base e when determining how much money I’d have in a bank account that earns compound interest subject to continuous compounding.
In Exercises 87–90, determine whether each statement is true or false. If the statement is false, make the necessary change(s) to produce a true statement.As the number of compounding periods increases on a fixed investment, the amount of money in the account over a fixed interval of time will
In Exercises 81–100, evaluate or simplify each expression without using a calculator.ln 1
In Exercises 87–90, determine whether each statement is true or false. If the statement is false, make the necessary change(s) to produce a true statement.The functions f(x) = 3-x and g(x) = -3x have the same graph.
Solve each logarithmic equation in Exercises 49–92. Be sure to reject any value of x that is not in the domain of the original logarithmic expressions. Give the exact answer. Then, where necessary, use a calculator to obtain a decimal approximation, correct to two decimal places, for the
Exercises 86–88 will help you prepare for the material covered in the first section.Solve: 5(2x - 3) - 4x = 9.
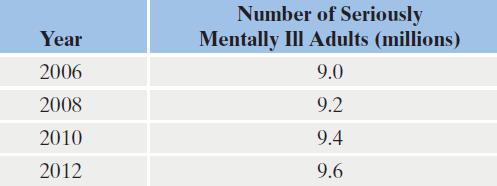
Exercises 89–91 present data in the form of tables. For each data set shown by the table,a. Create a scatter plot for the data.b. Use the scatter plot to determine whether an exponential function, a logarithmic function, or a linear function is the best choice for modeling the data.Number of
In Exercises 81–100, evaluate or simplify each expression without using a calculator.ln e
Solve each logarithmic equation in Exercises 49–92. Be sure to reject any value of x that is not in the domain of the original logarithmic expressions. Give the exact answer. Then, where necessary, use a calculator to obtain a decimal approximation, correct to two decimal places, for the
In Exercises 81–100, evaluate or simplify each expression without using a calculator.ln e6
In Exercises 81–100, evaluate or simplify each expression without using a calculator.ln e7
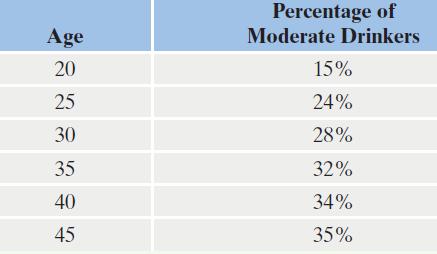
Exercises 89–91 present data in the form of tables. For each data set shown by the table,a. Create a scatter plot for the data.b. Use the scatter plot to determine whether an exponential function, a logarithmic function, or a linear function is the best choice for modeling the data.Percentage of
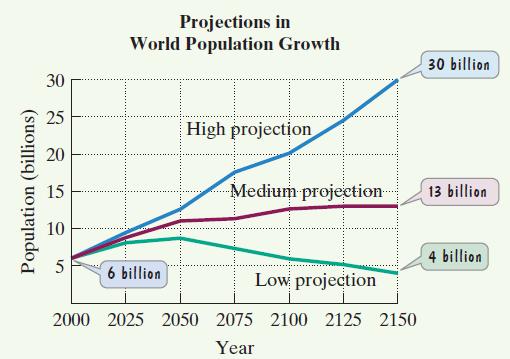
The figure shows world population projections through the year 2150. The data are from the United Nations Family Planning Program and are based on optimistic or pessimistic expectations for successful control of human population growth. Suppose that you are interested in modeling these data using
In Exercises 93–102, solve each equation. 2 ln x60
In Exercises 93–102, solve each equation. 3 log x 60
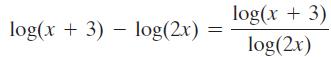
In Exercises 89–102, determine whether each equation is true or false. Where possible, show work to support your conclusion. If the statement is false, make the necessary change(s) to produce a true statement. log(x+3) log(2x) log(x + 3) log(2x)
Solve for y: 7x + 3y = 18.
In Exercises 93–102, solve each equation. 3¹² = 45
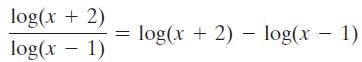
In Exercises 89–102, determine whether each equation is true or false. Where possible, show work to support your conclusion. If the statement is false, make the necessary change(s) to produce a true statement. log(x + 2) log(x - 1) log(x + 2) log(x - 1) - -
Find all zeros of f(x) = x3 + 5x2 - 8x + 2.
In Exercises 89–102, determine whether each equation is true or false. Where possible, show work to support your conclusion. If the statement is false, make the necessary change(s) to produce a true statement.ln(x + 1) = ln x + ln 1
In Exercises 93–102, solve each equation. 5x² = 50
In Exercises 81–100, evaluate or simplify each expression without using a calculator.ln e9x
In Exercises 81–100, evaluate or simplify each expression without using a calculator. 10logVx
In Exercises 89–102, determine whether each equation is true or false. Where possible, show work to support your conclusion. If the statement is false, make the necessary change(s) to produce a true statement.ln(5x) + ln 1 = ln(5x)
Solve and graph the solution set on a number line: 2x2 + 5x < 12.
In Exercises 81–100, evaluate or simplify each expression without using a calculator.ln e13x
In Exercises 81–100, evaluate or simplify each expression without using a calculator. 10logVx
In Exercises 89–102, determine whether each equation is true or false. Where possible, show work to support your conclusion. If the statement is false, make the necessary change(s) to produce a true statement.ln x + ln(2x) = ln(3x)
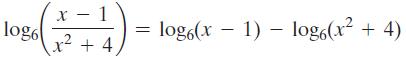
In Exercises 89–102, determine whether each equation is true or false. Where possible, show work to support your conclusion. If the statement is false, make the necessary change(s) to produce a true statement. log6 x-1 x² + 4. = log6(x1) log(x² + 4)
In Exercises 93–102, solve each equation.ln(2x + 1) + ln(x - 3) - 2 ln x = 0
In Exercises 81–100, evaluate or simplify each expression without using a calculator.eln 5x2
In Exercises 89–102, determine whether each equation is true or false. Where possible, show work to support your conclusion. If the statement is false, make the necessary change(s) to produce a true statement. et 1 In x
In Exercises 89–102, determine whether each equation is true or false. Where possible, show work to support your conclusion. If the statement is false, make the necessary change(s) to produce a true statement. log3 7 1 log73
In Exercises 81–100, evaluate or simplify each expression without using a calculator.eln 7x2
The formuladescribes the time, t, in weeks, that it takes to achieve mastery of a portion of a task, where A is the maximum learning possible, N is the portion of the learning that is to be achieved, and c is a constant used to measure an individual’s learning style.a. Express the formula so that
Exercises 97–99 will help you prepare for the material covered in the next section.Solve: (x - 3)2 > 0.
Exercises 97–99 will help you prepare for the material covered in the next section.25 to what power gives 5? (25? = 5)
In Exercises 93–102, solve each equation.ln 3 - ln(x + 5) - ln x = 0
In Exercises 101–104, write each equation in its equivalent exponential form. Then solve for x. log64 X 2/3
In Exercises 93–102, solve each equation.5x2-12 = 252x
In Exercises 101–104, write each equation in its equivalent exponential form. Then solve for x.log3(x - 1) = 2
The formula A = 37.3e0.0095t models the population of California, A, in millions, t years after 2010.a. What was the population of California in 2010?b. When will the population of California reach 40 million?
Showing 4800 - 4900
of 13634
First
42
43
44
45
46
47
48
49
50
51
52
53
54
55
56
Last
Step by Step Answers