New Semester
Started
Get
50% OFF
Study Help!
--h --m --s
Claim Now
Question Answers
Textbooks
Find textbooks, questions and answers
Oops, something went wrong!
Change your search query and then try again
S
Books
FREE
Study Help
Expert Questions
Accounting
General Management
Mathematics
Finance
Organizational Behaviour
Law
Physics
Operating System
Management Leadership
Sociology
Programming
Marketing
Database
Computer Network
Economics
Textbooks Solutions
Accounting
Managerial Accounting
Management Leadership
Cost Accounting
Statistics
Business Law
Corporate Finance
Finance
Economics
Auditing
Tutors
Online Tutors
Find a Tutor
Hire a Tutor
Become a Tutor
AI Tutor
AI Study Planner
NEW
Sell Books
Search
Search
Sign In
Register
study help
mathematics
college algebra graphs and models
College Algebra 7th Edition Robert F Blitzer - Solutions
In Exercises 93–102, solve each equation.3x2-12 = 92x
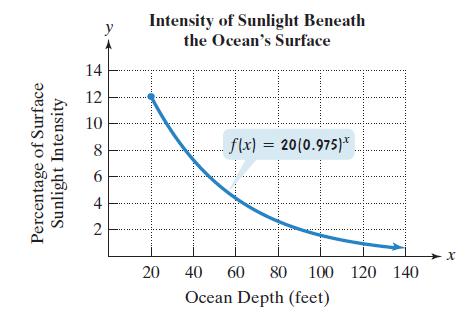
The function f(x) = 20(0.975)x models the percentage of surface sunlight, f(x), that reaches a depth of x feet beneath the surface of the ocean. The figure shows the graph of this function. Use this information to solve Exercises 105–106.Use the function to determine at what depth, to the nearest
The loudness level of a sound can be expressed by comparing the sound’s intensity to the intensity of a sound barely audible to the human ear. The formula D = 10(log I - log I0) describes the loudness level of a sound, D, in decibels, where I is the intensity of the sound, in watts per meter2,
In Exercises 89–102, determine whether each equation is true or false. Where possible, show work to support your conclusion. If the statement is false, make the necessary change(s) to produce a true statement.log6[4(x + 1)] = log6 4 + log6(x + 1)
The function f(x) = 20(0.975)x models the percentage of surface sunlight, f(x), that reaches a depth of x feet beneath the surface of the ocean. The figure shows the graph of this function. Use this information to solve Exercises 105–106.Use the function to determine at what depth, to the nearest
In Exercises 101–104, write each equation in its equivalent exponential form. Then solve for x.log5(x + 4) = 2
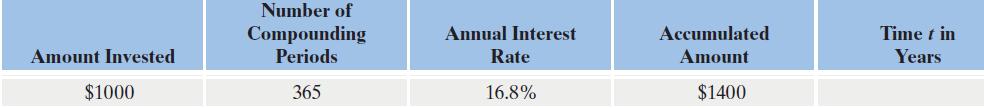
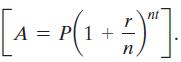
In Exercises 107–110, complete the table for a savings account subject to n compounding's yearly Round answers to one decimal place. nt [A = P(1 + # )" ]. n
In Exercises 107–110, complete the table for a savings account subject to n compounding's yearly Round answers to one decimal place. nt [A = P(1 + # )" ]. n
In Exercises 101–104, write each equation in its equivalent exponential form. Then solve for x.log4 x = -3
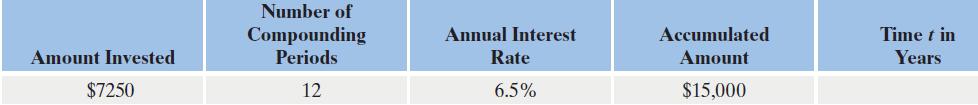
In Exercises 107–110, complete the table for a savings account subject to n compounding's yearly Round answers to one decimal place. nt [A = P(1 + # )" ]. n
The formula A = 25.1e0.0187t models the population of Texas, A, in millions, t years after 2010.a. What was the population of Texas in 2010?b. When will the population of Texas reach 28 million?
In Exercises 107–110, complete the table for a savings account subject to n compounding's yearly Round answers to one decimal place. nt [A = P(1 + # )" ]. n
In Exercises 105–108, evaluate each expression without using a calculator.log3(log7 7)
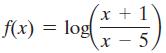
In Exercises 109–112, find the domain of each logarithmic function. f(x) = log x + 1 x - 5
In Exercises 111–114, complete the table for a savings account subject to continuous compounding (A = Pert). Round answers to one decimal place. Amount Invested $8000 Annual Interest Rate 8% Accumulated Amount Double the amount invested Time t in Years
In Exercises 109–112, find the domain of each logarithmic function. f(x) = log X 2 x + 5
In Exercises 105–108, evaluate each expression without using a calculator.log5(log2 32)
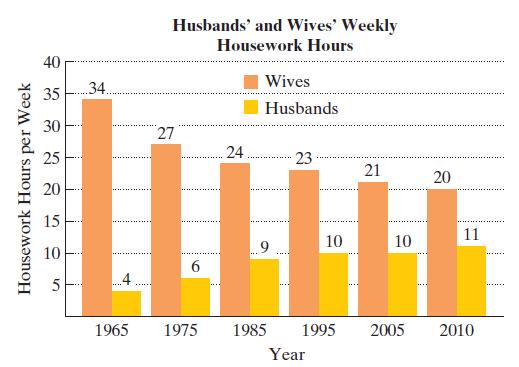
The bar graph shows the average number of hours per week that U.S. wives and husbands engaged in housework in six selected years. Use this information to solve Exercises 115–116.The function f(x) = -3.52 ln x + 34.5 models the wives’ weekly housework hours, f(x), x years after 1964.a. Use the
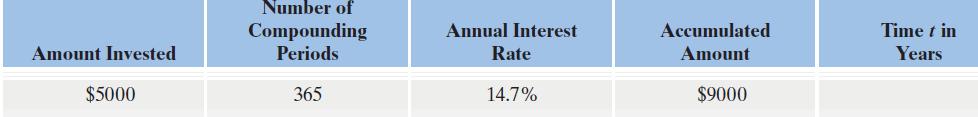
In Exercises 111–114, complete the table for a savings account subject to continuous compounding (A = Pert). Round answers to one decimal place. Amount Invested $2350 Annual Interest Rate 15.7% Accumulated Amount Triple the amount invested Time t in Years
Describe the product rule for logarithms and give an example.
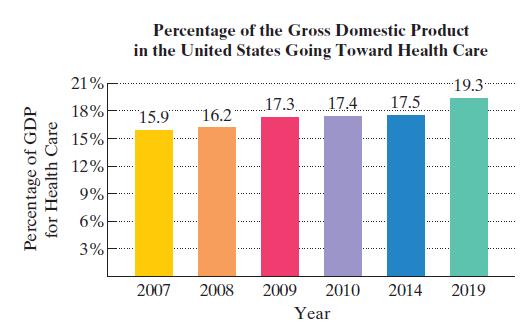
By 2019, nearly $1 out of every $5 spent in the U.S. economy is projected to go for health care. The bar graph shows the percentage of the U.S. gross domestic product (GDP) going toward health care from 2007 through 2014, with a projection for 2019.The data can be modeled by the function f (x) =
In Exercises 111–114, complete the table for a savings account subject to continuous compounding (A = Pert). Round answers to one decimal place. Amount Invested $8000 Annual Interest Rate 20.3% $12,000 Accumulated Amount Time t in Years
Describe the quotient rule for logarithms and give an example.
In Exercises 109–112, find the domain of each logarithmic function.f(x) = ln(x2 - x - 2)
By 2019, nearly $1 out of every $5 spent in the U.S. economy is projected to go for health care. The bar graph shows the percentage of the U.S. gross domestic product (GDP) going toward health care from 2007 through 2014, with a projection for 2019.The data can be modeled by the function f (x) =
The bar graph shows the average number of hours per week that U.S. wives and husbands engaged in housework in six selected years. Use this information to solve Exercises 115–116.The function f(x) = 1.8 ln x + 3.42 models the husbands’ weekly housework hours, f(x), x years after 1964.a. Use the
Describe the power rule for logarithms and give an example.
In Exercises 109–112, find the domain of each logarithmic function.f(x) = ln(x2 - 4x - 12)
In Exercises 111–114, complete the table for a savings account subject to continuous compounding (A = Pert). Round answers to one decimal place. Amount Invested $17,425 Annual Interest Rate 4.25% $25,000 Accumulated Amount Time t in Years
Without showing the details, explain how to condense ln x - 2 ln(x + 1).
a. Use a graphing utility (and the change-of-base property) to graph y = log3 x.b. Graph y = 2 + log3 x, y = log3(x + 2), and y = -log3 x in the same viewing rectangle as y = log3 x. Then describe the change or changes that need to be made to the graph of y = log3 x to obtain each of these three
Describe the change-of-base property and give an example.
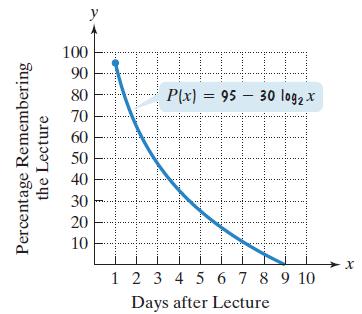
The function P(x) = 95 - 30 log2 x models the percentage, P(x), of students who could recall the important features of a classroom lecture as a function of time, where x represents the number of days that have elapsed since the lecture was given. The figure at the top of the next column shows the
Use a graphing utility and the change-of-base property to graph y = log3 x, y = log25 x, and y = log100 x in the same viewing rectangle.a. Which graph is on the top in the interval (0, 1)? Which is on the bottom?b. Which graph is on the top in the interval (1,∞)? Which is on the bottom?c.
Graph y = log x, y = log(10x), and y = log(0.1x) in the same viewing rectangle. Describe the relationship among the three graphs. What logarithmic property accounts for this relationship?
Explain how to use your calculator to find log14 283.
The percentage of adult height attained by a girl who is x years old can be modeled by f(x) = 62 + 35 log(x - 4), where x represents the girl’s age (from 5 to 15) and f(x) represents the percentage of her adult height. Use the function to solve Exercises 113–114. Round answers to the nearest
The percentage of adult height attained by a girl who is x years old can be modeled by f(x) = 62 + 35 log(x - 4), where x represents the girl’s age (from 5 to 15) and f(x) represents the percentage of her adult height. Use the function to solve Exercises 113–114. Round answers to the nearest
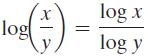
Disprove each statement in Exercises 116–120 bya. Letting y equal a positive constant of your choice, andb. Using a graphing utility to graph the function on each side of the equal sign. The two functions should have different graphs, showing that the equation is not true in general. log X log
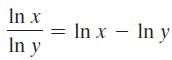
Disprove each statement in Exercises 116–120 bya. Letting y equal a positive constant of your choice, andb. Using a graphing utility to graph the function on each side of the equal sign. The two functions should have different graphs, showing that the equation is not true in general. In x In y =
The loudness level of a sound, D, in decibels, is given by the formula D = 10 log(1012I), where I is the intensity of the sound, in watts per meter2. Decibel levels range from 0, a barely audible sound, to 160, a sound resulting in a ruptured eardrum. (Any exposure to sounds of 130 decibels or
The loudness level of a sound, D, in decibels, is given by the formula D = 10 log(1012I), where I is the intensity of the sound, in watts per meter2. Decibel levels range from 0, a barely audible sound, to 160, a sound resulting in a ruptured eardrum. (Any exposure to sounds of 130 decibels or
Disprove each statement in Exercises 116–120 bya. Letting y equal a positive constant of your choice, andb. Using a graphing utility to graph the function on each side of the equal sign. The two functions should have different graphs, showing that the equation is not true in general.log(x + y) =
In Exercises 125–132, use your graphing utility to graph each side of the equation in the same viewing rectangle. Then use the x-coordinate of the intersection point to find the equation’s solution set. Verify this value by direct substitution into the equation.3x+1 = 9
Logarithmic models are well suited to phenomena in which growth is initially rapid but then begins to level off. Describe something that is changing over time that can be modeled using a logarithmic function.
In Exercises 81–100, evaluate or simplify each expression without using a calculator. 1 In- 6
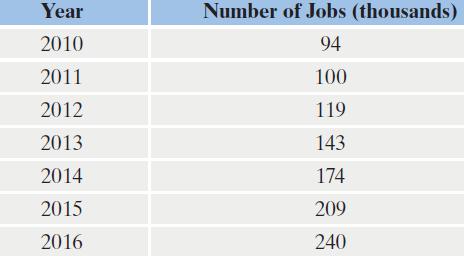
Exercises 89–91 present data in the form of tables. For each data set shown by the table,a. Create a scatter plot for the data.b. Use the scatter plot to determine whether an exponential function, a logarithmic function, or a linear function is the best choice for modeling the data.Number of Jobs
Solve each logarithmic equation in Exercises 49–92. Be sure to reject any value of x that is not in the domain of the original logarithmic expressions. Give the exact answer. Then, where necessary, use a calculator to obtain a decimal approximation, correct to two decimal places, for the
Solve each logarithmic equation in Exercises 49–92. Be sure to reject any value of x that is not in the domain of the original logarithmic expressions. Give the exact answer. Then, where necessary, use a calculator to obtain a decimal approximation, correct to two decimal places, for the
In Exercises 89–102, determine whether each equation is true or false. Where possible, show work to support your conclusion. If the statement is false, make the necessary change(s) to produce a true statement.ln 0 = e
In Exercises 89–102, determine whether each equation is true or false. Where possible, show work to support your conclusion. If the statement is false, make the necessary change(s) to produce a true statement. log4(2x³) = 3 log4(2x)
In Exercises 81–100, evaluate or simplify each expression without using a calculator. 1 In e
Solve each logarithmic equation in Exercises 49–92. Be sure to reject any value of x that is not in the domain of the original logarithmic expressions. Give the exact answer. Then, where necessary, use a calculator to obtain a decimal approximation, correct to two decimal places, for the
In Exercises 89–102, determine whether each equation is true or false. Where possible, show work to support your conclusion. If the statement is false, make the necessary change(s) to produce a true statement. In(8x³) = 3 In(2x)
In Exercises 92–93, rewrite the equation in terms of base e. Express the answer in terms of a natural logarithm and then round to three decimal places.y = 73(2.6)x
Graph f(x) = 2x and its inverse function in the same rectangular coordinate system.
In Exercises 93–102, solve each equation. 52x.54x 125
In Exercises 81–100, evaluate or simplify each expression without using a calculator.eln 125
In Exercises 92–93, rewrite the equation in terms of base e. Express the answer in terms of a natural logarithm and then round to three decimal places.y = 6.5(0.43)x
In Exercises 89–102, determine whether each equation is true or false. Where possible, show work to support your conclusion. If the statement is false, make the necessary change(s) to produce a true statement. x log 10 = x²
The hyperbolic cosine and hyperbolic sine functions are defined bya. Show that cosh x is an even function.b. Show that sinh x is an odd function.c. Prove that (cosh x)2 - (sinh x)2 = 1. cosh x = et + ex 2 and sinh x = et - ex 2
In Exercises 93–102, solve each equation. 3x+2.3t = 81
In Exercises 81–100, evaluate or simplify each expression without using a calculator.eln 300
In Exercises 9–42, write the partial fraction decomposition of each rational expression. 1 x(x - 1)
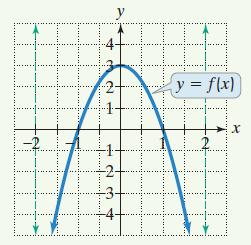
The figure shows the graph of y = f(x) and its two vertical asymptotes. Use the graph to solve Exercises 1–10.Use arrow notation to complete this statement: 2 I 8996 y = f(x) 0000 X
In Exercises 1–12, solve each system by the method of your choice. 2x - у + 2z = x + 2y - 3z = 3x-y - 4z = -8 9 3
Solve each system in Exercises 5–18. у + 3z 8 3x + y - 2z =-2 у 2x + 4y + z 0 =
In Exercises 5–18, solve each system by the substitution method. (2x - 3y = -13 ly = 2x + 7
A chemist needs to mix a solution that is 34% silver nitrate with one that is 4% silver nitrate to obtain 100 milliliters of a mixture that is 7% silver nitrate. How many milliliters of each of the solutions must be used?
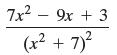
In Exercises 1–8, write the form of the partial fraction decomposition of the rational expression. It is not necessary to solve for the constants. 7x² - 9x + 3 (x² + 7)² 2
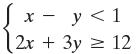
Fill in each blank so that the resulting statement is true.The solution set of the systemis the set of ordered pairs that satisfies________ and_______ . x - y < 1 2x + 3y = 12
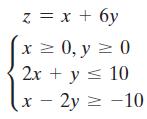
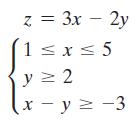
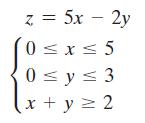
In Exercises 5–14, an objective function and a system of linear inequalities representing constraints are given.a. Graph the system of inequalities representing the constraints.b. Find the value of the objective function at each corner of the graphed region.c. Use the values in part (b) to
In Exercises 1–26, graph each inequality. V y > 3x + 2
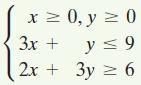
In Exercises 7–10, graph the solution set of each inequality or system of inequalities. x ≥ 0, y = 0 3x + y ≤ 9 2x + 3y = 6
Fill in each blank so that the resulting statement is true.A company’s________ function is the money generated by selling x units of its product. The difference between this function and the company’s cost function is called its________ function.
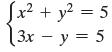
In Exercises 1–18, solve each system by the substitution method. 2 [x² + y² = 5 3x - y = 5
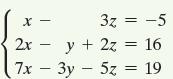
In Exercises 1–12, solve each system by the method of your choice. 3z = -5 2xy + 2z = 16 7x3y5z = 19 X
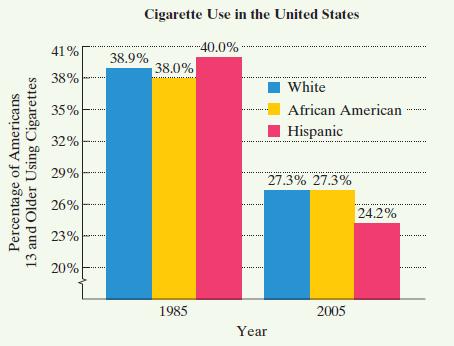
The bar graph in the next column shows the percentage of Americans who used cigarettes, by ethnicity, in 1985 and 2005. For each of the groups shown, cigarette use has been linearly decreasing.a. In 1985, 38% of African Americans used cigarettes. For the period shown by the graph, this has
In Exercises 5–14, an objective function and a system of linear inequalities representing constraints are given.a. Graph the system of inequalities representing the constraints.b. Find the value of the objective function at each corner of the graphed region.c. Use the values in part (b) to
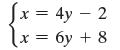
In Exercises 5–18, solve each system by the substitution method. x = 4y - 2 x = бу + 8
The figure shows the graph of y = f(x) and its two vertical asymptotes. Use the graph to solve Exercises 1–10.Does f appear to be even, odd, or neither? 2 I 8996 y = f(x) 0000 X
In Exercises 9–42, write the partial fraction decomposition of each rational expression. x (x − 3)(x - 2)
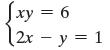
In Exercises 1–18, solve each system by the substitution method. Jxy = 6 (2x - y = 1
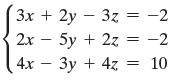
Solve each system in Exercises 5–18. = = -2 3x + 2y3z 2x - 5y + 2z = -2 4x3y + 4z = 10
In Exercises 5–14, an objective function and a system of linear inequalities representing constraints are given.a. Graph the system of inequalities representing the constraints.b. Find the value of the objective function at each corner of the graphed region.c. Use the values in part (b) to
In Exercises 1–26, graph each inequality. x ≤ 1
The figure shows the graph of y = f(x) and its two vertical asymptotes. Use the graph to solve Exercises 1–10.Graph g(x) = f(x + 2) - 1. 2 I 8996 y = f(x) 0000 X
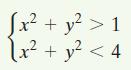
In Exercises 7–10, graph the solution set of each inequality or system of inequalities. [x2 + y > 1 [x2 + y² < 4
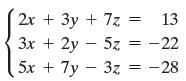
Solve each system in Exercises 5–18. 13 2x + 3y + 7z 3x + 2y 5z = -22 - 5x + 7y3z = -28 =
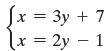
In Exercises 5–18, solve each system by the substitution method. Jx X = 3y + 7 = 2y 1
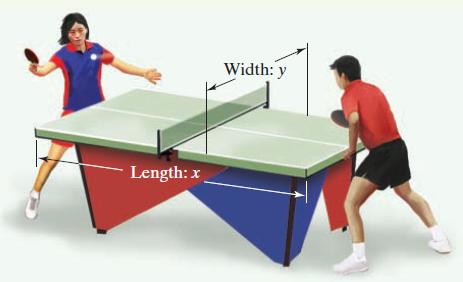
The perimeter of a table tennis top is 28 feet. The difference between 4 times the length and 3 times the width is 21 feet. Find the dimensions. Length: x Width: y
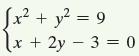
In Exercises 1–12, solve each system by the method of your choice. √x² + y² = 9 lx x + 2y + 2y3 = 0
In Exercises 1–26, graph each inequality. x = -3
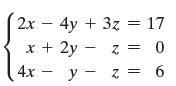
Solve each system in Exercises 5–18. 2x - 4y + 3z 17 = x + 2y y 4x - z = z = 0 6
The figure shows the graph of y = f(x) and its two vertical asymptotes. Use the graph to solve Exercises 1–10.Graph 2 I 8996 y = f(x) 0000 X
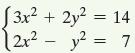
In Exercises 1–12, solve each system by the method of your choice. [3x² + 2y² = 14 x2 22 - 2 7
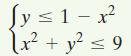
In Exercises 7–10, graph the solution set of each inequality or system of inequalities. Jy≤1-x² [x² + y² ≤ 9 2
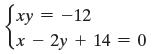
In Exercises 1–18, solve each system by the substitution method. Jxy = -12 x - 2y + 14 = 0
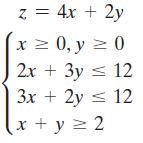
In Exercises 5–14, an objective function and a system of linear inequalities representing constraints are given.a. Graph the system of inequalities representing the constraints.b. Find the value of the objective function at each corner of the graphed region.c. Use the values in part (b) to
In Exercises 11–21, solve each equation, inequality, or system of equations. √x² – 3x 3x = 2x - 6
Showing 4900 - 5000
of 13634
First
43
44
45
46
47
48
49
50
51
52
53
54
55
56
57
Last
Step by Step Answers