New Semester
Started
Get
50% OFF
Study Help!
--h --m --s
Claim Now
Question Answers
Textbooks
Find textbooks, questions and answers
Oops, something went wrong!
Change your search query and then try again
S
Books
FREE
Study Help
Expert Questions
Accounting
General Management
Mathematics
Finance
Organizational Behaviour
Law
Physics
Operating System
Management Leadership
Sociology
Programming
Marketing
Database
Computer Network
Economics
Textbooks Solutions
Accounting
Managerial Accounting
Management Leadership
Cost Accounting
Statistics
Business Law
Corporate Finance
Finance
Economics
Auditing
Tutors
Online Tutors
Find a Tutor
Hire a Tutor
Become a Tutor
AI Tutor
AI Study Planner
NEW
Sell Books
Search
Search
Sign In
Register
study help
mathematics
college algebra graphs and models
College Algebra 7th Edition Robert F Blitzer - Solutions
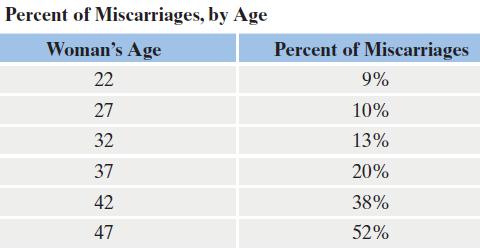
Exercises 47–52 present data in the form of tables. For each data set shown by the table,a. Create a scatter plot for the data.b. Use the scatter plot to determine whether an exponential function, a logarithmic function, or a linear function is the best choice for modeling the data. Percent of
In Exercises 41–70, use properties of logarithms to condense each logarithmic expression. Write the expression as a single logarithm whose coefficient is 1. Where possible, evaluate logarithmic expressions without using a calculator.log(2x + 5) - log x
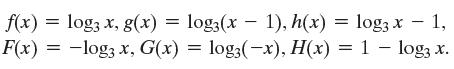
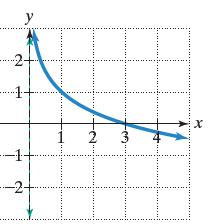
In Exercises 47–52, the graph of a logarithmic function is given. Select the function for each graph from the following options: f(x) = log3 x, g(x) = F(x) = −log3 x, G(x) log3(x - 1), h(x) - 1), h(x) = log3x - 1, = log3(-x), H(x) = 1 - log3 x. = log3(x
Solve each exponential equation in Exercises 23–48. Express the solution set in terms of natural logarithms or common logarithms. Then use a calculator to obtain a decimal approximation, correct to two decimal places, for the solution.32x + 3x - 2 = 0
In Exercises 47–52, graph functions f and g in the same rectangular coordinate system. Graph and give equations of all asymptotes. If applicable, use a graphing utility to confirm your hand-drawn graphs.f(x) = 3x and g(x) = 3-x
On the Richter scale, the magnitude, R, of an earthquake of intensity I is given by R = log I /I0 , where I0 is the intensity of a barely felt zero-level earthquake. If the intensity of an earthquake is 1000I0, what is its magnitude on the Richter scale?
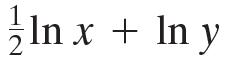
In Exercises 41–70, use properties of logarithms to condense each logarithmic expression. Write the expression as a single logarithm whose coefficient is 1. Where possible, evaluate logarithmic expressions without using a calculator. ln x + ln y
Solve each logarithmic equation in Exercises 49–92. Be sure to reject any value of x that is not in the domain of the original logarithmic expressions. Give the exact answer. Then, where necessary, use a calculator to obtain a decimal approximation, correct to two decimal places, for the
Use the compound interest formulas and A = Pert to solve Exercises 53–56. Round answers to the nearest cent.Suppose that you have $12,000 to invest. Which investment yields the greater return over 3 years: 7% compounded monthly or 6.85% compounded continuously? A = P(1 n nt
Use the compound interest formulas and A = Pert to solve Exercises 53–56. Round answers to the nearest cent.Find the accumulated value of an investment of $10,000 for 5 years at an interest rate of 5.5% if the money isa. Compounded semiannually;b. Compounded quarterly;c. Compounded monthly;d.
In Exercises 53–58, begin by graphing f(x) = log2 x. Then use transformations of this graph to graph the given function. What is the vertical asymptote? Use the graphs to determine each function’s domain and range.g(x) = log2(x + 1)
In Exercises 54–57, use properties of logarithms to condense each logarithmic expression. Write the expression as a single logarithm whose coefficient is 1.logb 7 + logb 3
In Exercises 41–70, use properties of logarithms to condense each logarithmic expression. Write the expression as a single logarithm whose coefficient is 1. Where possible, evaluate logarithmic expressions without using a calculator. 5 logbx + 6 logby
In Exercises 53–56, rewrite the equation in terms of base e. Express the answer in terms of a natural logarithm and then round to three decimal places.y = 1000(7.3)x
In Exercises 53–58, begin by graphing f(x) = log2 x. Then use transformations of this graph to graph the given function. What is the vertical asymptote? Use the graphs to determine each function’s domain and range.g(x) = log2(x + 2)
Use the compound interest formulas and A = Pert to solve Exercises 53–56. Round answers to the nearest cent.Find the accumulated value of an investment of $5000 for 10 years at an interest rate of 6.5% if the money isa. Compounded semiannually;b. Compounded quarterly;c. Compounded monthly;d.
Use the exponential decay model, A = A0ekt, to solve Exercises 28–31. Round answers to one decimal place.The half-life of thorium-229 is 7340 years. How long will it take for a sample of this substance to decay to 20% of its original amount?
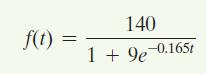
The logistic growth functiondescribes the population, f(t), of an endangered species of elk t years after they were introduced to a nonthreatening habitat.a. How many elk were initially introduced to the habitat?b. How many elk are expected in the habitat after 10 years?c. What is the limiting size
In Exercises 25–34, begin by graphing f(x) = 2x. Then use transformations of this graph to graph the given function. Be sure to graph and give equations of the asymptotes. Use the graphs to determine each function’s domain and range. If applicable, use a graphing utility to confirm your
In Exercises 21–42, evaluate each expression without using a calculator. log, V7
Solve each exponential equation in Exercises 23–48. Express the solution set in terms of natural logarithms or common logarithms. Then use a calculator to obtain a decimal approximation, correct to two decimal places, for the solution.5ex = 23
In Exercises 19–29, evaluate each expression without using a calculator. If evaluation is not possible, state the reason.log3(log8 8)
Solve each logarithmic equation in Exercises 49–92. Be sure to reject any value of x that is not in the domain of the original logarithmic expressions. Give the exact answer. Then, where necessary, use a calculator to obtain a decimal approximation, correct to two decimal places, for the
In Exercises 41–70, use properties of logarithms to condense each logarithmic expression. Write the expression as a single logarithm whose coefficient is 1. Where possible, evaluate logarithmic expressions without using a calculator.5 ln x - 2 ln y
In Exercises 53–56, rewrite the equation in terms of base e. Express the answer in terms of a natural logarithm and then round to three decimal places.y = 2.5(0.7)x
In Exercises 54–57, use properties of logarithms to condense each logarithmic expression. Write the expression as a single logarithm whose coefficient is 1.log 3 - 3 log x
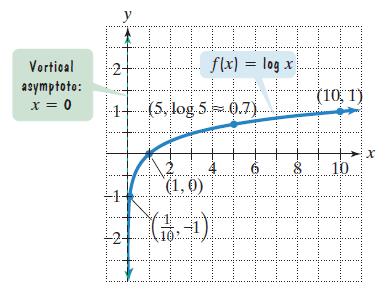
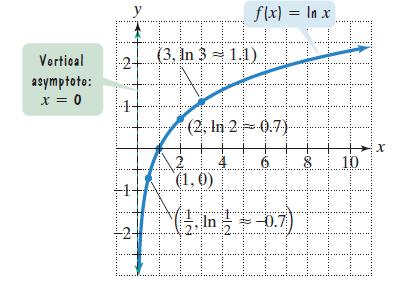
The figure shows the graph of f(x) = log x. In Exercises 59–64, use transformations of this graph to graph each function. Graph and give equations of the asymptotes. Use the graphs to determine each function’s domain and range.h(x) = log x - 2 Vortical asymptoto: x = 0 -1- W y 15 LIIII f(x) =
In Exercises 60–63, determine whether each equation is true or false. Where possible, show work to support your conclusion. If the statement is false, make the necessary change(s) to produce a true statement.ln ex = x ln e
Solve each logarithmic equation in Exercises 49–92. Be sure to reject any value of x that is not in the domain of the original logarithmic expressions. Give the exact answer. Then, where necessary, use a calculator to obtain a decimal approximation, correct to two decimal places, for the
In Exercises 41–70, use properties of logarithms to condense each logarithmic expression. Write the expression as a single logarithm whose coefficient is 1. Where possible, evaluate logarithmic expressions without using a calculator.4 ln x + 7 ln y - 3 ln z
Describe the shape of a scatter plot that suggests modeling the data with an exponential function.
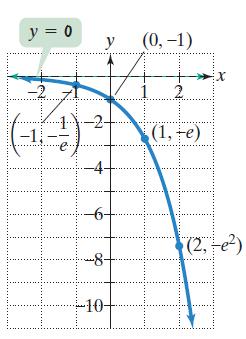
In Exercises 61–64, give the equation of each exponential function whose graph is shown. y = 0 -1 y -2- -4- -6- ~8- -10- (0, -1) (1,te) X (2, -e²)
In Exercises 41–70, use properties of logarithms to condense each logarithmic expression. Write the expression as a single logarithm whose coefficient is 1. Where possible, evaluate logarithmic expressions without using a calculator. (log x + log y)
You take up weightlifting and record the maximum number of pounds you can lift at the end of each week. You start off with rapid growth in terms of the weight you can lift from week to week, but then the growth begins to level off. Describe how to obtain a function that models the number of pounds
The figure shows the graph of f(x) = log x. In Exercises 59–64, use transformations of this graph to graph each function. Graph and give equations of the asymptotes. Use the graphs to determine each function’s domain and range.g(x) = 1 - log x Vortical asymptoto: x = 0 -1- W y 15 LIIII f(x) =
Solve each logarithmic equation in Exercises 49–92. Be sure to reject any value of x that is not in the domain of the original logarithmic expressions. Give the exact answer. Then, where necessary, use a calculator to obtain a decimal approximation, correct to two decimal places, for the
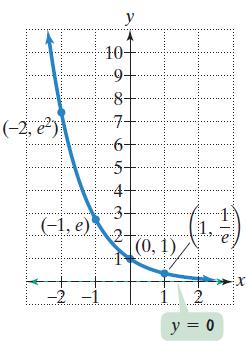
In Exercises 61–64, give the equation of each exponential function whose graph is shown. (-2, e²) (-1, e): -2 -1 y 10- 9- ·8- 7- -6+ --5- 4- [(0,1) 2 y = 0 X
In Exercises 64–73, solve each exponential equation. Where necessary, express the solution set in terms of natural or common logarithms and use a calculator to obtain a decimal approximation, correct to two decimal places, for the solution.24x-2 = 64
In Exercises 41–70, use properties of logarithms to condense each logarithmic expression. Write the expression as a single logarithm whose coefficient is 1. Where possible, evaluate logarithmic expressions without using a calculator. HIM. (log4x - log4y)
The figure shows the graph of f(x) = log x. In Exercises 59–64, use transformations of this graph to graph each function. Graph and give equations of the asymptotes. Use the graphs to determine each function’s domain and range.g(x) = 2 - log x Vortical asymptoto: x = 0 -1- W y 15 LIIII f(x) =
In Exercises 64–73, solve each exponential equation. Where necessary, express the solution set in terms of natural or common logarithms and use a calculator to obtain a decimal approximation, correct to two decimal places, for the solution.125x = 25
Solve each logarithmic equation in Exercises 49–92. Be sure to reject any value of x that is not in the domain of the original logarithmic expressions. Give the exact answer. Then, where necessary, use a calculator to obtain a decimal approximation, correct to two decimal places, for the
The figure shows the graph of f(x) = ln x. In Exercises 65–74, use transformations of this graph to graph each function. Graph and give equations of the asymptotes. Use the graphs to determine each function’s domain and range.g(x) = ln(x + 2) Vertical asymptoto: x = 0 e H W C y f(x) = ln
In Exercises 41–70, use properties of logarithms to condense each logarithmic expression. Write the expression as a single logarithm whose coefficient is 1. Where possible, evaluate logarithmic expressions without using a calculator. (log5 x + logs y) - 2 log(x + 1)
In Exercises 64–73, solve each exponential equation. Where necessary, express the solution set in terms of natural or common logarithms and use a calculator to obtain a decimal approximation, correct to two decimal places, for the solution.10x = 7000
Use a calculator with a yx key or a ∧ key to solve Exercises 65–70.India is currently one of the world’s fastest-growing countries. By 2040, the population of India will be larger than the population of China; by 2050, nearly one-third of the world’s population will live in these two
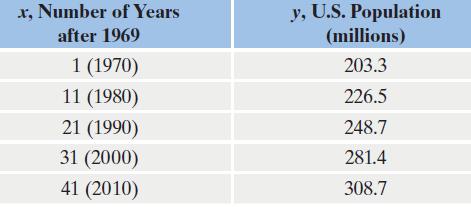
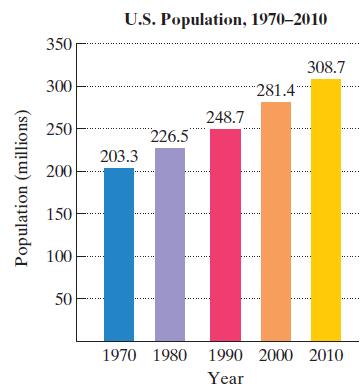
In Example 1, we used two data points and an exponential function to model the population of the United States from 1970 through 2010. The data are shown again in the table. Use all five data points to solve Exercises 66–70.Data from example 1The graph in Figure 4.22 shows the U.S. population, in
The figure shows the graph of f(x) = ln x. In Exercises 65–74, use transformations of this graph to graph each function. Graph and give equations of the asymptotes. Use the graphs to determine each function’s domain and range.g(x) = ln(x + 1) Vertical asymptoto: x = 0 e H W C y f(x) = ln
In Exercises 41–70, use properties of logarithms to condense each logarithmic expression. Write the expression as a single logarithm whose coefficient is 1. Where possible, evaluate logarithmic expressions without using a calculator. (log4x log4y) + 2log4(x + 1) -
In Example 1, we used two data points and an exponential function to model the population of the United States from 1970 through 2010. The data are shown again in the table. Use all five data points to solve Exercises 66–70.Data from example 1The graph in Figure 4.22 shows the U.S. population, in
Solve each logarithmic equation in Exercises 49–92. Be sure to reject any value of x that is not in the domain of the original logarithmic expressions. Give the exact answer. Then, where necessary, use a calculator to obtain a decimal approximation, correct to two decimal places, for the
The figure shows the graph of f(x) = ln x. In Exercises 65–74, use transformations of this graph to graph each function. Graph and give equations of the asymptotes. Use the graphs to determine each function’s domain and range.h(x) = ln(2x) Vertical asymptoto: x = 0 e H W C y f(x) = ln
In Exercises 41–70, use properties of logarithms to condense each logarithmic expression. Write the expression as a single logarithm whose coefficient is 1. Where possible, evaluate logarithmic expressions without using a calculator. [2ln(x + 5) In x - In(x² - 4)]
In Example 1, we used two data points and an exponential function to model the population of the United States from 1970 through 2010. The data are shown again in the table. Use all five data points to solve Exercises 66–70.Data from example 1The graph in Figure 4.22 shows the U.S. population, in
The figure shows the graph of f(x) = ln x. In Exercises 65–74, use transformations of this graph to graph each function. Graph and give equations of the asymptotes. Use the graphs to determine each function’s domain and range.h(x) = ln(1/2 x) Vertical asymptoto: x = 0 e H W C y f(x) = ln
Use a calculator with a yx key or a ∧ key to solve Exercises 65–70.The 1986 explosion at the Chernobyl nuclear power plant in the former Soviet Union sent about 1000 kilograms of radioactive cesium-137 into the atmosphere. The function f(x) = 1000(0.5) x/30 describes the amount, f(x), in
In Exercises 41–70, use properties of logarithms to condense each logarithmic expression. Write the expression as a single logarithm whose coefficient is 1. Where possible, evaluate logarithmic expressions without using a calculator. [5 ln(x + 6) - Inx - ln(x² - 25)]
In Exercises 64–73, solve each exponential equation. Where necessary, express the solution set in terms of natural or common logarithms and use a calculator to obtain a decimal approximation, correct to two decimal places, for the solution.9x+2 = 27-x
Use a calculator with a yx key or a ∧ key to solve Exercises 65–70.The formula S = C(1 + r)t models inflation, where C = the value today, r = the annual inflation rate, and S = the inflated value t years from now. Use this formula to solve Exercises 67–68. Round answers to the nearest dollar.
The figure shows the graph of f(x) = ln x. In Exercises 65–74, use transformations of this graph to graph each function. Graph and give equations of the asymptotes. Use the graphs to determine each function’s domain and range.g(x) = 2 ln x Vertical asymptoto: x = 0 e H W C y f(x) = ln
Solve each logarithmic equation in Exercises 49–92. Be sure to reject any value of x that is not in the domain of the original logarithmic expressions. Give the exact answer. Then, where necessary, use a calculator to obtain a decimal approximation, correct to two decimal places, for the
In Example 1, we used two data points and an exponential function to model the population of the United States from 1970 through 2010. The data are shown again in the table. Use all five data points to solve Exercises 66–70.Data from example 1The graph in Figure 4.22 shows the U.S. population, in
In Exercises 41–70, use properties of logarithms to condense each logarithmic expression. Write the expression as a single logarithm whose coefficient is 1. Where possible, evaluate logarithmic expressions without using a calculator. log x + log(x² - 1) - log 7 - log(x + 1)
In Exercises 64–73, solve each exponential equation. Where necessary, express the solution set in terms of natural or common logarithms and use a calculator to obtain a decimal approximation, correct to two decimal places, for the solution.8x = 12,143
Use a calculator with a yx key or a ∧ key to solve Exercises 65–70.The formula S = C(1 + r)t models inflation, where C = the value today, r = the annual inflation rate, and S = the inflated value t years from now. Use this formula to solve Exercises 67–68. Round answers to the nearest dollar.
Solve each logarithmic equation in Exercises 49–92. Be sure to reject any value of x that is not in the domain of the original logarithmic expressions. Give the exact answer. Then, where necessary, use a calculator to obtain a decimal approximation, correct to two decimal places, for the
In Exercises 41–70, use properties of logarithms to condense each logarithmic expression. Write the expression as a single logarithm whose coefficient is 1. Where possible, evaluate logarithmic expressions without using a calculator. log x + log(x² - 4) - log 15 - log(x + 2)
In Exercises 64–73, solve each exponential equation. Where necessary, express the solution set in terms of natural or common logarithms and use a calculator to obtain a decimal approximation, correct to two decimal places, for the solution.9e5x = 1269
The figure shows the graph of f(x) = ln x. In Exercises 65–74, use transformations of this graph to graph each function. Graph and give equations of the asymptotes. Use the graphs to determine each function’s domain and range.g(x) = 1/2 ln x Vertical asymptoto: x = 0 e H W C y f(x) = ln
Use a calculator with a yx key or a ∧ key to solve Exercises 65–70.A decimal approximation for √3 is 1.7320508. Use a calculator to find 21.7, 21.73, 21.732, 21.73205, and 21.7320508. Now find 2√3. What do you observe?
Solve each logarithmic equation in Exercises 49–92. Be sure to reject any value of x that is not in the domain of the original logarithmic expressions. Give the exact answer. Then, where necessary, use a calculator to obtain a decimal approximation, correct to two decimal places, for the
In Exercises 64–73, solve each exponential equation. Where necessary, express the solution set in terms of natural or common logarithms and use a calculator to obtain a decimal approximation, correct to two decimal places, for the solution.e12-5x - 7 = 123
Use a calculator with a yx key or a ∧ key to solve Exercises 65–70.A decimal approximation for π is 3.141593. Use a calculator to find 23, 23.1, 23.14, 23.141, 23.1415, 23.14159, and 23.141593. Now find 2π. What do you observe?
Solve each logarithmic equation in Exercises 49–92. Be sure to reject any value of x that is not in the domain of the original logarithmic expressions. Give the exact answer. Then, where necessary, use a calculator to obtain a decimal approximation, correct to two decimal places, for the
In Exercises 64–73, solve each exponential equation. Where necessary, express the solution set in terms of natural or common logarithms and use a calculator to obtain a decimal approximation, correct to two decimal places, for the solution.54x+2 = 37,500
Solve each logarithmic equation in Exercises 49–92. Be sure to reject any value of x that is not in the domain of the original logarithmic expressions. Give the exact answer. Then, where necessary, use a calculator to obtain a decimal approximation, correct to two decimal places, for the
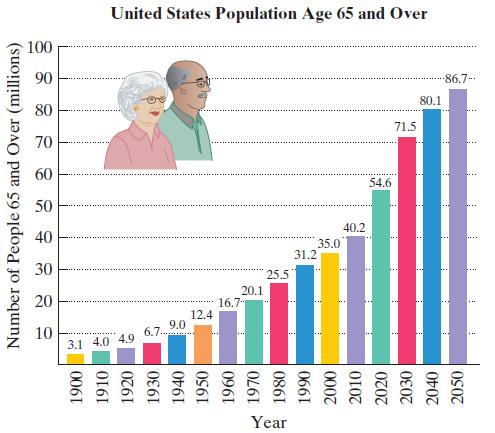
The figure shows the number of people in the United States age 65 and over, with projected figures for the year 2020 and beyond.a. Let x represent the number of years after 1899 and let y represent the U.S. population age 65 and over, in millions. Use your graphing utility to find the model that
In Exercises 71–78, use common logarithms or natural logarithms and a calculator to evaluate to four decimal places.log5 13
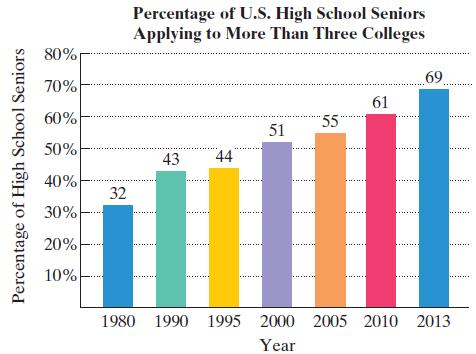
Use a calculator with an ex key to solve Exercises 71–76. The bar graph shows the percentage of U.S. high school seniors who applied to more than three colleges for selected years from 1980 through 2013.The data can be modeled by f(x) = x + 31 and g(x) = 32.7e0.0217x, in which f(x) and g(x)
Solve each logarithmic equation in Exercises 49–92. Be sure to reject any value of x that is not in the domain of the original logarithmic expressions. Give the exact answer. Then, where necessary, use a calculator to obtain a decimal approximation, correct to two decimal places, for the
The figure shows the graph of f(x) = ln x. In Exercises 65–74, use transformations of this graph to graph each function. Graph and give equations of the asymptotes. Use the graphs to determine each function’s domain and range.h(x) = -ln x Vertical asymptoto: x = 0 e H W C y f(x) = ln
In Exercises 64–73, solve each exponential equation. Where necessary, express the solution set in terms of natural or common logarithms and use a calculator to obtain a decimal approximation, correct to two decimal places, for the solution.3x+4 = 72x-1
In Exercises 71–78, use common logarithms or natural logarithms and a calculator to evaluate to four decimal places.log6 17
Use a calculator with an ex key to solve Exercises 71–76. The bar graph shows the percentage of U.S. high school seniors who applied to more than three colleges for selected years from 1980 through 2013.The data can be modeled by f(x) = x + 31 and g(x) = 32.7e0.0217x, in which f(x) and g(x)
Solve each logarithmic equation in Exercises 49–92. Be sure to reject any value of x that is not in the domain of the original logarithmic expressions. Give the exact answer. Then, where necessary, use a calculator to obtain a decimal approximation, correct to two decimal places, for the
The figure shows the graph of f(x) = ln x. In Exercises 65–74, use transformations of this graph to graph each function. Graph and give equations of the asymptotes. Use the graphs to determine each function’s domain and range.h(x) = ln(-x) Vertical asymptoto: x = 0 e H W C y f(x) = ln
In Exercises 64–73, solve each exponential equation. Where necessary, express the solution set in terms of natural or common logarithms and use a calculator to obtain a decimal approximation, correct to two decimal places, for the solution.e2x - ex - 6 = 0
In Exercises 71–78, use common logarithms or natural logarithms and a calculator to evaluate to four decimal places.log14 87.5
Use a calculator with an ex key to solve Exercises 71–76. The bar graph shows the percentage of U.S. high school seniors who applied to more than three colleges for selected years from 1980 through 2013.In college, we study large volumes of information— information that, unfortunately, we do
The figure shows the graph of f(x) = ln x. In Exercises 65–74, use transformations of this graph to graph each function. Graph and give equations of the asymptotes. Use the graphs to determine each function’s domain and range.g(x) = 2 - ln x Vertical asymptoto: x = 0 e H W C y f(x) = ln
In Exercises 71–78, use common logarithms or natural logarithms and a calculator to evaluate to four decimal places.log16 57.2
In Exercises 74–79, solve each logarithmic equation.log4(3x - 5) = 3
Solve each logarithmic equation in Exercises 49–92. Be sure to reject any value of x that is not in the domain of the original logarithmic expressions. Give the exact answer. Then, where necessary, use a calculator to obtain a decimal approximation, correct to two decimal places, for the
In Exercises 73–76, determine whether each statement makes sense or does not make sense, and explain your reasoning.I used an exponential model with a positive growth rate to describe the depreciation in my car’s value over four years.
Use a calculator with an ex key to solve Exercises 71–76. The bar graph shows the percentage of U.S. high school seniors who applied to more than three colleges for selected years from 1980 through 2013.In 1626, Peter Minuit convinced the Wappinger Indians to sell him Manhattan Island for $24. If
The figure shows the graph of f(x) = ln x. In Exercises 65–74, use transformations of this graph to graph each function. Graph and give equations of the asymptotes. Use the graphs to determine each function’s domain and range.g(x) = 1 - ln x Vertical asymptoto: x = 0 e H W C y f(x) = ln
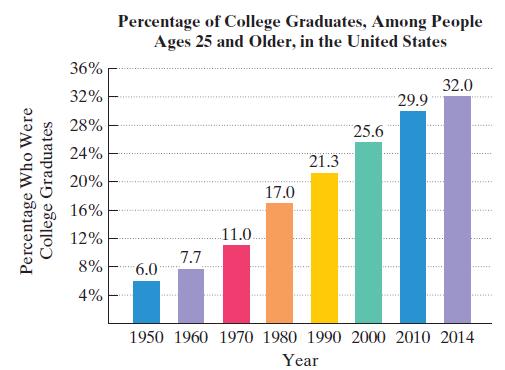
Use a calculator with an ex key to solve Exercises 71–76. The bar graph shows the percentage of U.S. high school seniors who applied to more than three colleges for selected years from 1980 through 2013.The bar graph shows the percentage of people 25 years of age and older who were college
Use a calculator with an ex key to solve Exercises 71–76. The bar graph shows the percentage of U.S. high school seniors who applied to more than three colleges for selected years from 1980 through 2013.The bar graph shows the percentage of people 25 years of age and older who were college
Solve each logarithmic equation in Exercises 49–92. Be sure to reject any value of x that is not in the domain of the original logarithmic expressions. Give the exact answer. Then, where necessary, use a calculator to obtain a decimal approximation, correct to two decimal places, for the
In Exercises 74–79, solve each logarithmic equation.3 + 4 ln(2x) = 15
Showing 5300 - 5400
of 13634
First
47
48
49
50
51
52
53
54
55
56
57
58
59
60
61
Last
Step by Step Answers