New Semester
Started
Get
50% OFF
Study Help!
--h --m --s
Claim Now
Question Answers
Textbooks
Find textbooks, questions and answers
Oops, something went wrong!
Change your search query and then try again
S
Books
FREE
Study Help
Expert Questions
Accounting
General Management
Mathematics
Finance
Organizational Behaviour
Law
Physics
Operating System
Management Leadership
Sociology
Programming
Marketing
Database
Computer Network
Economics
Textbooks Solutions
Accounting
Managerial Accounting
Management Leadership
Cost Accounting
Statistics
Business Law
Corporate Finance
Finance
Economics
Auditing
Tutors
Online Tutors
Find a Tutor
Hire a Tutor
Become a Tutor
AI Tutor
AI Study Planner
NEW
Sell Books
Search
Search
Sign In
Register
study help
mathematics
college algebra graphs and models
College Algebra 7th Edition Robert F Blitzer - Solutions
The quantity y of a product supplied in thousands is related to its price by the equation y = 1.5 + x, where x is price in dollars. The quantity demanded y for the same product is represented by y = 16 - 4x. (a) Find the price at which this product is sold. (b) Find the quantity sold at
Determine if it is possible to construct a cylindrical container, including the top and bottom, with a volume of 38 cubic inches and a surface area of 38 square inches.
A student takes out two loans totaling $3000 to help pay for college expenses. One loan is at 8% interest, and the other is at 10%. Interest for both loans is compounded annually. (a) If the first-year interest is $264, write a system of equations whose solution is the amount of each
A box has rectangular sides, and its rectangular top and base are twice as long as they are wide. Its volume is 588 cubic inches, and its outside surface area is 448 square inches. Find its dimensions.
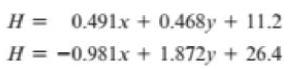
In one study a group of athletes were exercised to exhaustion. Let x and y represent an athlete's heart rate 5 seconds and 10 seconds after stopping exercise, respectively. It was found that the maximum heart rate H for these athletes satisfied the following two equations.If an athlete had a
The relationship between a professional basketball player's height h in inches and weight w in pounds was modeled using two samples of players. The resulting modeling equations for the two samples were w = 7.46h - 374 and w = 7.93h 405. Assume that 65 ≤ h ≤ 85. (a) Use each equation to
Suppose a rectangular pen for a pet is to be made using 40 feet of fence. Let / represent its length and w its width, with l ≥ w. (a) Find / and w if the area is 91 square feet. (b) Write a formula for the area A in terms of w. (c) What is the maximum area possible for the pen?
Suppose that both loans have an interest rate of 10% and the total first-year interest is $300. If possible, determine the amount of each loan. Interpret your results.
Suppose that both loans are at 10% and the total annual interest is $264. If possible, determine the amount of each loan. Interpret your results.
From 2010 to 2015 the average number of hours that a user spent on the Internet each week increased by 139%. This percent increase amounted to 25 hours. Find the average number of hours that a user spent on the Internet each week in 2010 and 2015. Round to the nearest hour.
The surface area of the skin covering the human body is a func- tion of more than one variable. A taller person tends to have a larger surface area, as does a heavier person. Both height and weight influence the surface area of a person's body. A formula used to deter- mine the surface area of a
A student invests $5000 at two annual interest rates, 5% and 7%. After 1 year the student receives a total of $325 in interest. How much did the student invest at each interest rate?
A jet airliner travels 1680 miles in 3 hours with a tail wind. The return trip, into the wind, takes 3.5 hours. Find both the speed of the jet with no wind and the wind speed.
A tugboat can pull a barge 60 miles upstream in 15 hours. The same tugboat and barge can make the return trip downstream in 6 hours. Determine the speed of the current in the river.
The electrical power generated by a windmill varies jointly with the square of the diameter of the area swept out by the blades and the cube of the wind velocity. If a windmill with an 8-foot diameter and a 10-mile-per-hour wind generates 2405 watts, how much power would be generated if the blades
American battlefield deaths in World Wars I and II totaled about 345,000. There were about 5.5 times as many deaths in World War II as World War I. Find the number of American battlefield deaths in each war. Round your answers to the nearest whole number.
The strength of a rectangular beam varies jointly with its width and the square of its thickness. If a beam 5.5 inches wide and 2.5 inches thick supports 600 pounds, how much can a similar beam that is 4 inches wide and 1.5 inches thick support?
One cord of wood contains 128 cubic feet. Estimate the number of cords in a tree that is 105 feet tall and has a diameter of 38 inches.
The cost of carpet for a rectangular room varies jointly with its width and length. If a room 10 feet wide and 12 feet long costs $1560 to carpet, find the cost to carpet a room that is 11 feet by 23 feet. Interpret the constant of variation.
Give an example of a quantity occurring in everyday life that can be computed by a function of more than one input. Identify the inputs and the output.
Give an example of a system of linear equations with two variables. Explain how to solve the system graphically and symbolically
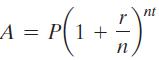
Use the compound interest formulas and A = Pert to solve Exercises 53–56. Round answers to the nearest cent.Suppose that you have $6000 to invest. Which investment yields the greater return over 4 years: 8.25% compounded quarterly or 8.3% compounded semiannually? A = P(1 n nt
In Exercises 53–58, begin by graphing f(x) = log2 x. Then use transformations of this graph to graph the given function. What is the vertical asymptote? Use the graphs to determine each function’s domain and range.h(x) = 1 + log2 x
In Exercises 54–57, use properties of logarithms to condense each logarithmic expression. Write the expression as a single logarithm whose coefficient is 1.3 ln x + 4 ln y
In Exercises 53–56, rewrite the equation in terms of base e. Express the answer in terms of a natural logarithm and then round to three decimal places.y = 4.5(0.6)x
In Exercises 41–70, use properties of logarithms to condense each logarithmic expression. Write the expression as a single logarithm whose coefficient is 1. Where possible, evaluate logarithmic expressions without using a calculator.7 ln x - 3 ln y
Solve each logarithmic equation in Exercises 49–92. Be sure to reject any value of x that is not in the domain of the original logarithmic expressions. Give the exact answer. Then, where necessary, use a calculator to obtain a decimal approximation, correct to two decimal places, for the
In Exercises 57–58, graph f and g in the same rectangular coordinate system. Then find the point of intersection of the two graphs. f(x) = 2*, g(x) = 2*
In Exercises 54–57, use properties of logarithms to condense each logarithmic expression. Write the expression as a single logarithm whose coefficient is 1. In x - In y
In Exercises 53–58, begin by graphing f(x) = log2 x. Then use transformations of this graph to graph the given function. What is the vertical asymptote? Use the graphs to determine each function’s domain and range.h(x) = 2 + log2 x
In Exercises 57–58, graph f and g in the same rectangular coordinate system. Then find the point of intersection of the two graphs. f(x) = 2x+1, g(x) = 2x+1
In Exercises 41–70, use properties of logarithms to condense each logarithmic expression. Write the expression as a single logarithm whose coefficient is 1. Where possible, evaluate logarithmic expressions without using a calculator. 2 ln x In y
In Exercises 41–70, use properties of logarithms to condense each logarithmic expression. Write the expression as a single logarithm whose coefficient is 1. Where possible, evaluate logarithmic expressions without using a calculator. 4 ln(x + 6) 3 ln x
Solve each logarithmic equation in Exercises 49–92. Be sure to reject any value of x that is not in the domain of the original logarithmic expressions. Give the exact answer. Then, where necessary, use a calculator to obtain a decimal approximation, correct to two decimal places, for the
In Exercises 53–58, begin by graphing f(x) = log2 x. Then use transformations of this graph to graph the given function. What is the vertical asymptote? Use the graphs to determine each function’s domain and range.g(x) = 1/2 log2 x
Nigeria has a growth rate of 0.025 or 2.5%. Describe what this means.
In Exercises 58–59, use common logarithms or natural logarithms and a calculator to evaluate to four decimal places.log6 72,348
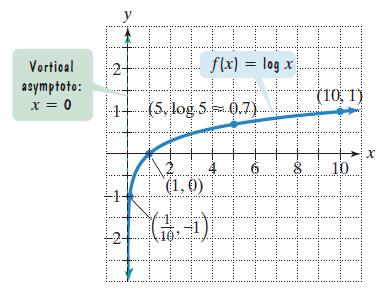
The figure shows the graph of f(x) = log x. In Exercises 59–64, use transformations of this graph to graph each function. Graph and give equations of the asymptotes. Use the graphs to determine each function’s domain and range.g(x) = log(x - 1) Vortical asymptoto: x = 0 -1- W y 15 LIIII f(x) =
Solve each logarithmic equation in Exercises 49–92. Be sure to reject any value of x that is not in the domain of the original logarithmic expressions. Give the exact answer. Then, where necessary, use a calculator to obtain a decimal approximation, correct to two decimal places, for the
In Exercises 53–58, begin by graphing f(x) = log2 x. Then use transformations of this graph to graph the given function. What is the vertical asymptote? Use the graphs to determine each function’s domain and range.g(x) = -2log2 x
How can you tell whether an exponential model describes exponential growth or exponential decay?
In Exercises 58–59, use common logarithms or natural logarithms and a calculator to evaluate to four decimal places.log4 0.863
Graph y = 2x and x = 2y in the same rectangular coordinate system.
The figure shows the graph of f(x) = log x. In Exercises 59–64, use transformations of this graph to graph each function. Graph and give equations of the asymptotes. Use the graphs to determine each function’s domain and range.g(x) = log(x - 2) Vortical asymptoto: x = 0 -1- W y 15 LIIII f(x) =
Solve each logarithmic equation in Exercises 49–92. Be sure to reject any value of x that is not in the domain of the original logarithmic expressions. Give the exact answer. Then, where necessary, use a calculator to obtain a decimal approximation, correct to two decimal places, for the
Suppose that a population that is growing exponentially increases from 800,000 people in 2010 to 1,000,000 people in 2013. Without showing the details, describe how to obtain the exponential growth function that models the data.
The figure shows the graph of f(x) = log x. In Exercises 59–64, use transformations of this graph to graph each function. Graph and give equations of the asymptotes. Use the graphs to determine each function’s domain and range.h(x) = log x - 1 Vortical asymptoto: x = 0 -1- W y 15 LIIII f(x) =
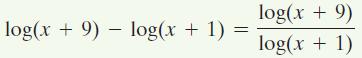
In Exercises 60–63, determine whether each equation is true or false. Where possible, show work to support your conclusion. If the statement is false, make the necessary change(s) to produce a true statement. log(x + 9) log(x + 1) = log(x + 9) log(x + 1)
In Exercises 61–64, give the equation of each exponential function whose graph is shown. (0, 1) -2 -1 y = 0 y -20- 16- 12- -8- 70 ㅁ (2, 16) (1,4) (-1, 1) 2 X
Graph y = 3x and x = 3y in the same rectangular coordinate system.
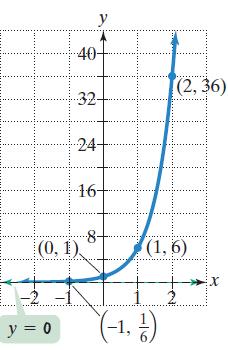
In Exercises 61–64, give the equation of each exponential function whose graph is shown. y = 0 y 40- 32- 24- (0, 1) 16- 8- (2,36) (1,6) (-1, 1) X
In Exercises 41–70, use properties of logarithms to condense each logarithmic expression. Write the expression as a single logarithm whose coefficient is 1. Where possible, evaluate logarithmic expressions without using a calculator.8 ln(x + 9) - 4 ln x
In Exercises 60–63, determine whether each equation is true or false. Where possible, show work to support your conclusion. If the statement is false, make the necessary change(s) to produce a true statement.(ln x)(ln 1) = 0
Solve each logarithmic equation in Exercises 49–92. Be sure to reject any value of x that is not in the domain of the original logarithmic expressions. Give the exact answer. Then, where necessary, use a calculator to obtain a decimal approximation, correct to two decimal places, for the
In Exercises 60–63, determine whether each equation is true or false. Where possible, show work to support your conclusion. If the statement is false, make the necessary change(s) to produce a true statement. (log₂ x) = 4 log₂x
What is the half-life of a substance?
In Exercises 41–70, use properties of logarithms to condense each logarithmic expression. Write the expression as a single logarithm whose coefficient is 1. Where possible, evaluate logarithmic expressions without using a calculator.3 ln x + 5 ln y - 6 ln z
Solve each logarithmic equation in Exercises 49–92. Be sure to reject any value of x that is not in the domain of the original logarithmic expressions. Give the exact answer. Then, where necessary, use a calculator to obtain a decimal approximation, correct to two decimal places, for the
Describe a difference between exponential growth and logistic growth.
In Exercises 41–70, use properties of logarithms to condense each logarithmic expression. Write the expression as a single logarithm whose coefficient is 1. Where possible, evaluate logarithmic expressions without using a calculator. 3 In x - In y
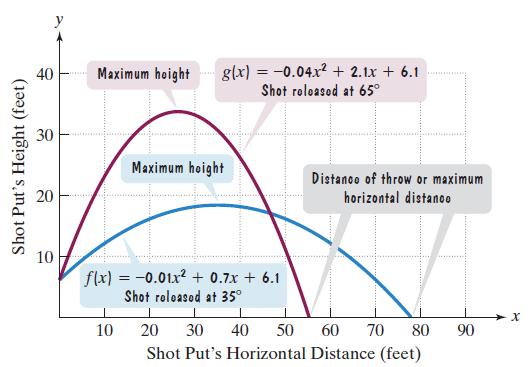
An athlete whose event is the shot put releases the shot with the same initial velocity but at different angles. The figure shows the parabolic paths for shots released at angles of 35° and 65°. Exercises 57–58 are based on the functions that model the parabolic paths.When the shot whose path
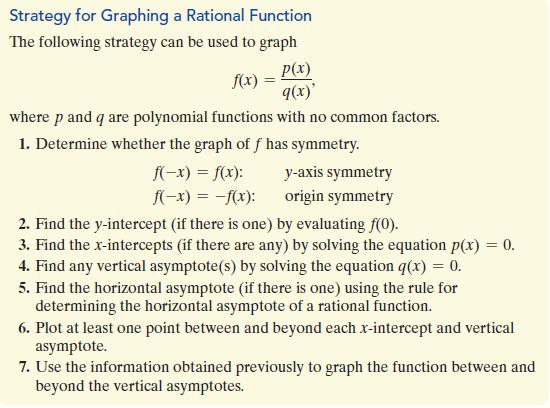
In Exercises 57–80, follow the seven steps to graph each rational function.Seven Steps are given below Strategy for Graphing a Rational Function The following strategy can be used to graph p(x) f(x) q(x)' where p and q are polynomial functions with no common factors. 1. Determine whether the
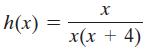
In Exercises 21–36, find the vertical asymptotes, if any, and the values of x corresponding to holes, if any, of the graph of each rational function. h(x) = X x(x + 4)
In Exercises 17–32, divide using synthetic division. - + = + (* + *ς – XS - *) 5x3 + x4) + (5 + x)
An athlete whose event is the shot put releases the shot with the same initial velocity but at different angles. The figure shows the parabolic paths for shots released at angles of 35° and 65°. Exercises 57–58 are based on the functions that model the parabolic paths.When the shot whose path
The distance that a spring will stretch varies directly as the force applied to the spring. A force of 12 pounds is needed to stretch a spring 9 inches. What force is required to stretch the spring 15 inches?
Solve each polynomial inequality in Exercises 1–42 and graph the solution set on a real number line. Express each solution set in interval notation. x² = 4x - 2 X VI
In Exercises 21–36, find the vertical asymptotes, if any, and the values of x corresponding to holes, if any, of the graph of each rational function. h(x) = X x(x − 3)
In Exercises 25–32, find an nth-degree polynomial function with real coefficients satisfying the given conditions. If you are using a graphing utility, use it to graph the function and verify the real zeros and the given function value. n = 3; 1 and 5i are zeros; f(-1) = -104
In Exercises 25–26, find an nth-degree polynomial function with real coefficients satisfying the given conditions.n = 3; 1 and i are zeros; f(-1) = 8
In Exercises 17–32, divide using synthetic division. (x² 6x6x³ + x4) + (6 + x)
In Exercises 57–80, follow the seven steps to graph each rational function.Seven Steps are given below Strategy for Graphing a Rational Function The following strategy can be used to graph p(x) f(x) q(x)' where p and q are polynomial functions with no common factors. 1. Determine whether the
In Exercises 17–38, use the vertex and intercepts to sketch the graph of each quadratic function. Give the equation of the parabola’s axis of symmetry. Use the graph to determine the function’s domain and range.f(x) = 4 - (x - 1)2
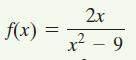
In Exercises 57–64, find the vertical asymptotes, if any, the horizontal asymptote, if one exists, and the slant asymptote, if there is one, of the graph of each rational function. Then graph the rational function. f(x) = 2x x² - 9
The intensity of light received at a source varies inversely as the square of the distance from the source. A particular light has an intensity of 20 foot-candles at 15 feet. What is the light’s intensity at 10 feet?
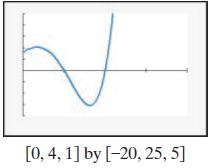
Exercises 53–60 show incomplete graphs of given polynomial functions.a. Find all the zeros of each function.b. Without using a graphing utility, draw a complete graph of the function.f(x) = 3x5 + 2x4 - 15x3 - 10x2 + 12x + 8 H [0, 4, 1] by [-20, 25, 5]
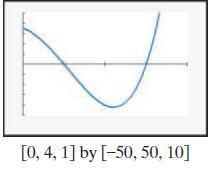
Exercises 53–60 show incomplete graphs of given polynomial functions.a. Find all the zeros of each function.b. Without using a graphing utility, draw a complete graph of the function.f(x) = 2x4 + 2x3 - 22x2 - 18x + 36 [0, 4, 1] by [-50, 50, 10]
Solve each polynomial inequality in Exercises 1–42 and graph the solution set on a real number line. Express each solution set in interval notation. +² < 2x + 2
In Exercises 25–26, graph each polynomial function.f(x) = 2x2(x - 1)3(x + 2)
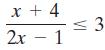
Solve each rational inequality in Exercises 43–60 and graph the solution set on a real number line. Express each solution set in interval notation. x + 4 2x 1 VI 3
In Exercises 25–32, find the zeros for each polynomial function and give the multiplicity for each zero. State whether the graph crosses the x-axis, or touches the x-axis and turns around, at each zero.f(x) = 2(x - 5)(x + 4)2
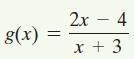
In Exercises 57–64, find the vertical asymptotes, if any, the horizontal asymptote, if one exists, and the slant asymptote, if there is one, of the graph of each rational function. Then graph the rational function. g(x) 2x - 4 x + 3
In Exercises 41–64,a. Use the Leading Coefficient Test to determine the graph’s end behavior.b. Find the x-intercepts. State whether the graph crosses the x-axis, or touches the x-axis and turns around, at each intercept.c. Find the y-intercept.d. Determine whether the graph has y-axis
In Exercises 17–38, use the vertex and intercepts to sketch the graph of each quadratic function. Give the equation of the parabola’s axis of symmetry. Use the graph to determine the function’s domain and range.f(x) = 1 - (x - 3)2
In Exercises 25–26, graph each polynomial function.f(x) = -x3(x + 4)2(x - 1)
In Exercises 25–32, find the zeros for each polynomial function and give the multiplicity for each zero. State whether the graph crosses the x-axis, or touches the x-axis and turns around, at each zero.f(x) = 3(x + 5)(x + 2)2
In Exercises 41–64,a. Use the Leading Coefficient Test to determine the graph’s end behavior.b. Find the x-intercepts. State whether the graph crosses the x-axis, or touches the x-axis and turns around, at each intercept.c. Find the y-intercept.d. Determine whether the graph has y-axis
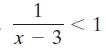
Solve each rational inequality in Exercises 43–60 and graph the solution set on a real number line. Express each solution set in interval notation. 1 x - 3 < 1
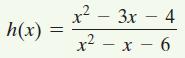
In Exercises 57–64, find the vertical asymptotes, if any, the horizontal asymptote, if one exists, and the slant asymptote, if there is one, of the graph of each rational function. Then graph the rational function. h(x) = x² - 3x - 4 x²-x-6
Explain how to perform long division of polynomials. Use 2x3 - 3x2 - 11x + 7 divided by x - 3 in your explanation.
Begin by deciding on a product that interests the group because you are now in charge of advertising this product. Members were told that the demand for the product varies directly as the amount spent on advertising and inversely as the price of the product. However, as more money is spent on
In Exercises 95–98, use long division to rewrite the equation for g in the formThen use this form of the function’s equation and transformations of f(x) = 1/x to graph g. quotient + remainder divisor
You invested $20,000 in two accounts paying 7% and 9% annual interest. If the total interest earned for the year is $1550, how much was invested at each rate?
In Exercises 62–63, use transformations of your graph from Exercise 61 to graph each function.Data from Exercise 61Use point plotting to graph f(x) = 2x. Begin by setting up a partial table of coordinates, selecting integers from -3 to 3, inclusive, for x. Because y = 0 is a horizontal asymptote,
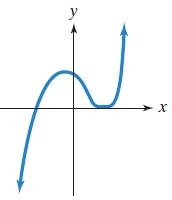
In Exercises 93–96, the graph of a polynomial function is given. What is the smallest degree that each polynomial could have? y X
In Exercises 94–97, use a graphing utility with a viewing rectangle large enough to show end behavior to graph each polynomial function.f(x) = -2x3 + 6x2 + 3x - 1
In Exercises 95–98, use long division to rewrite the equation for g in the formThen use this form of the function’s equation and transformations of f(x) = 1/x to graph g. quotient + remainder divisor
In Exercises 95–98, use long division to rewrite the equation for g in the formThen use this form of the function’s equation and transformations of f(x) = 1/x to graph g. quotient + remainder divisor
In Exercises 95–96, find the axis of symmetry for each parabola whose equation is given. Use the axis of symmetry to find a second point on the parabola whose y-coordinate is the same as the given point.f(x) = (x - 3)2 + 2; (6, 11)
In Exercises 94–97, use a graphing utility with a viewing rectangle large enough to show end behavior to graph each polynomial function.f(x) = -x4 + 8x3 + 4x2 + 2
Showing 7100 - 7200
of 13634
First
65
66
67
68
69
70
71
72
73
74
75
76
77
78
79
Last
Step by Step Answers