New Semester
Started
Get
50% OFF
Study Help!
--h --m --s
Claim Now
Question Answers
Textbooks
Find textbooks, questions and answers
Oops, something went wrong!
Change your search query and then try again
S
Books
FREE
Study Help
Expert Questions
Accounting
General Management
Mathematics
Finance
Organizational Behaviour
Law
Physics
Operating System
Management Leadership
Sociology
Programming
Marketing
Database
Computer Network
Economics
Textbooks Solutions
Accounting
Managerial Accounting
Management Leadership
Cost Accounting
Statistics
Business Law
Corporate Finance
Finance
Economics
Auditing
Tutors
Online Tutors
Find a Tutor
Hire a Tutor
Become a Tutor
AI Tutor
AI Study Planner
NEW
Sell Books
Search
Search
Sign In
Register
study help
mathematics
college algebra graphs and models
College Algebra 7th Edition Robert F Blitzer - Solutions
Expand the expression. If possible, write your answer without exponents. In 3.x
Describe verbally the inverse of the statement. Then express both the given statement and its inverse symbolically.Multiply x by 5.
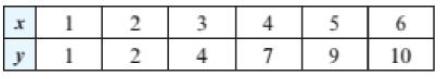
Make a scatterplot of the data. Then find an exponential, logarithmic, or logistic function f that best models the data. 1 1 2 2 3 4 4 7 5 9 6 10
Simplify the expression without a calculator. 95/6 91/3
Complete the following. Round your answers to two decimal places. (a) Find the average rate of change of f(x) = ex from x to x + 0.001 for the given x. (b) Approximate f(x)= ex for the given x. (c) Compare your answers in parts (a) and (b).x = 1.5
Expand the expression. If possible, write your answer without exponents. In 7a
Describe verbally the inverse of the statement. Then express both the given statement and its inverse symbolically.Subtract 2 from x and multiply the result by 3.
Simplify the expression without a calculator. 3⁰
Suppose that a person's salary is initially $30,000 and is modeled by f(x), where x represents the number of years of experience. Use f(x) to approximate the years of experience when the salary first exceeds $60,000. (a) f(x) = 30,000(1.1)x (b) f(x) = 30,000 log (10 + x) Would most
Describe verbally the inverse of the statement. Then express both the given statement and its inverse symbolically.Divide x by 20 and then add 10.
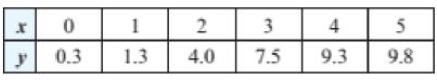
Make a scatterplot of the data. Then find an exponential, logarithmic, or logistic function f that best models the data. r 0 0.3 1 1.3 2 4.0 3 7.5 4 9.3 5 9.8
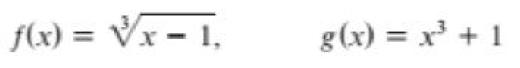
Describe verbally the inverse of the statement. Then express both the given statement and its inverse symbolically.Take the cube root of x and add 1.
What is the pattern in the results from Exercises 5-8? You may want to test your conjecture by trying different values of x.Complete the following. Round your answers to two decimal places. (a) Find the average rate of change of f(x) = ex from x to x + 0.001 for the given x. (b)
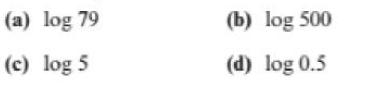
Determine mentally an integer n so that the logarithm is between n and n + 1. Check your result with a calculator. (a) log 79 (c) log 5 (b) log 500 (d) log 0.5
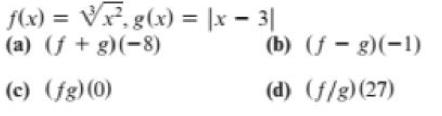
Use f(x) and g(x) to evaluate each expression symbolically. f(x) = √². g(x) = |x - 3| (a) (f + g)(-8) (c) (fg)(0) (b) (f- g)(-1) (d) (f/g) (27)
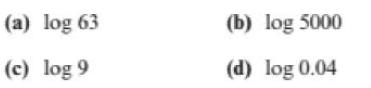
Determine mentally an integer n so that the logarithm is between n and n + 1. Check your result with a calculator. (a) log 63 (c) log 9 (b) log 5000 (d) log 0.04
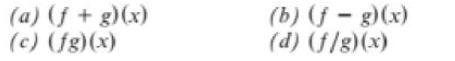
Use f(x) and g(x) to find a formula for each expression. Identify its domain. (a) (f + g)(x) (c) (fg)(x) (b) (f- g)(x) (d) (f/g)(x)
Expand the expression. If possible, write your answer without exponents. log- 3
Simplify the expression without a calculator. 0
Expand the expression. If possible, write your answer without exponents. 6 log-
For any real number k, what is a good approximation for the average rate of change of f(x) = ex on a small interval near x = k? Explain how your answer relates to the graph of f(x) = ex.
Describe verbally the inverse of the statement. Then express both the given statement and its inverse symbolically.Multiply x by -2 and add 3.
Solve the polynomial inequality. (a) Symbolically and (b) Graphically. Use interval notation to write the solution set. 4x45x²9≥0
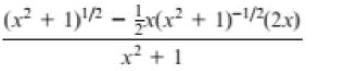
Write the expression as one ratio without any negative exponents. (x² + 1)¹/² − x(x² + 1)-¹/²(2x) x² + 1
Solve the equation 4x3/2 - 3 = 29.
Determine if f is even. odd, or neither. f(x) = -5x³ - 18
Solve the equation. √5x4=x-2.
Determine if f is even. odd, or neither. f(x) = 7x² + 3x³ = x
Determine whether f is a rational function and state its domain. f(x) = 3x x² +1
Use positive exponents to rewrite. -(EA)
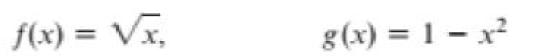
Are f(x) = x4 - 5x3 - 7 and g(x) = √9 - x2 even, odd, or neither?
If possible, sketch a graph that statisfies the following conditions.A quadratic function with two nonreal complex zeros and a negative leading coefficient
A degree 6 function f has zeros -3, 1, and 4 with multiplicities 1, 2, and 3, respectively. If the leading coef- ficient is 4, write the complete factored form of f(x).
Solve the equation. 2x² + x + 2 = 0
Find the average rate of change of f(x) = x3 + 1 from x = -2 to x = -1.
Find the difference quotient for f(x) = x + 6x.
Solve the equation. (a) n²+ 6n¹ = 16 (b) 2x2/3 + 5x¹/3 - 12 = 0
Determine if f is even. odd, or neither. f(x) 1 1+x²
Find a and b so that f(x) = axb models the data.
Write the slope-intercept form for a line that passes through (-2, 5) and (3,-4).
Write the slope-intercept form for a line that passes through (-1,4) and is perpendicular to the line 3x - 4y = 12.
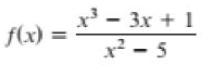
Determine whether f is a rational function and state its domain. f(x) x³ - 3x + 1 x²-5
Write an equation of a line that is parallel to the x-axis and passes through (4,-5).
Sketch a graph of a polynomial function that satisfies the given conditions.Cubic polynomial, two x-intercepts, and a positive leading coefficient
Solve -2.4x - 2.1 = √3x + 1.7 both graphically and numerically. Round your answer to the nearest tenth.
Solve the equation. -3(2-3x)-(-x-1)= 1
State the end behavior of f. f(x) = 1-2x - xª
Solve the equation. x + 5 = 5x +x
Solve the equation. |3x - 4 + 1 = 5
Find the difference quotient for g(x) = 4x3.
Sketch a graph of a polynomial function that satisfies the given conditions.Degree 4 with a positive leading coefficient, three turning points, and one x-intercept
If C(x) = 15x + 2000 calculates the cost in dollars of producing x radios, interpret the numbers 15 and 2000 in the formula for C(x).
Determine the x- and y-intercepts on the graph of 5x - 4y = 10. Graph the equation.
Solve the polynomial inequality. Use interval notation to write the solution set. 0<
Solve the polynomial inequality. Use interval notation to write the solution set. x4 - x < 0
Solve the polynomial inequality. Use interval notation to write the solution set. 0 < - - x
Solve the polynomial inequality. Use interval notation to write the solution set. x³ + x² < 0
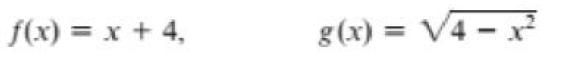
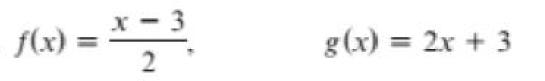
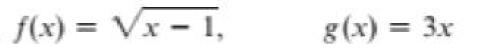
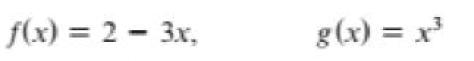
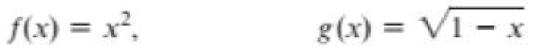
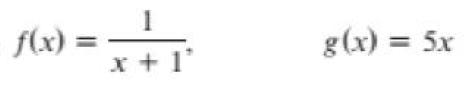
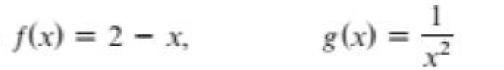
Use the given f(x) and g(x) to find each of the following. Identify its domain. (a) (fog)(x) (b) (gof)(x) (c) (f•f)(x)
Use the given f(x) and g(x) to find each of the following. Identify its domain. (a) (fog)(x) (b) (gof)(x) (c) (f•f)(x)
Use the given f(x) and g(x) to find each of the following. Identify its domain. (a) (fog)(x) (b) (gof)(x) (c) (f•f)(x)
Use the given f(x) and g(x) to find each of the following. Identify its domain. (a) (fog)(x) (b) (gof)(x) (c) (f•f)(x)
Use the given f(x) and g(x) to find each of the following. Identify its domain. (a) (fog)(x) (b) (gof)(x) (c) (f•f)(x)
Use the given f(x) and g(x) to find each of the following. Identify its domain. (a) (fog)(x) (b) (gof)(x) (c) (f•f)(x)
Use the given f(x) and g(x) to find each of the following. Identify its domain. (a) (fog)(x) (b) (gof)(x) (c) (f•f)(x)
Use the given f(x) and g(x) to find each of the following. Identify its domain. (a) (fog)(x) (b) (gof)(x) (c) (f•f)(x)
Use the given f(x) and g(x) to find each of the following. Identify its domain. (a) (fog)(x) (b) (gof)(x) (c) (f•f)(x)
Use the given f(x) and g(x) to find each of the following. Identify its domain. (a) (fog)(x) (b) (gof)(x) (c) (f•f)(x)
Use the given f(x) and g(x) to find each of the following. Identify its domain. (a) (fog)(x) (b) (gof)(x) (c) (f•f)(x)
Use the given f(x) and g(x) to find each of the following. Identify its domain. (a) (fog)(x) (b) (gof)(x) (c) (f•f)(x)
Use the given f(x) and g(x) to find each of the following. Identify its domain. (a) (fog)(x) (b) (gof)(x) (c) (f•f)(x)
Use the given f(x) and g(x) to find each of the following. Identify its domain. (a) (fog)(x) (b) (gof)(x) (c) (f•f)(x)
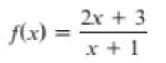
Graph y = f(x). You may want to use division, factoring, or transformations as an aid. Show all asymptotes and "holes." f(x) 2x + 3 x+1
Solve the equation. 8 = X
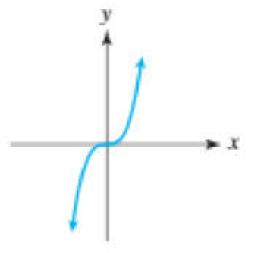
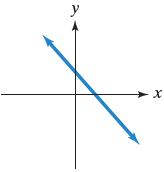
Use the given graph of y = axn, where n is a nonzero integer to complete the following. (a) Is n odd or even? Is n positive or negative? (b) Is the coefficient a positive or negative? (c) Over what interval(s) is f(x) positive? negative? (d) Over what interval(s) is the graph increasing?
If f(3) = 2 and g(3) = 5, (f + g)(3)
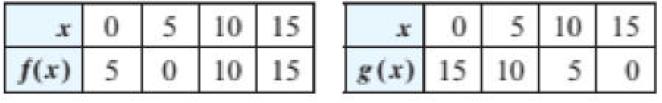
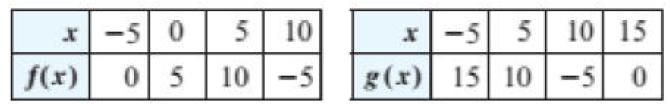
Tables for the functions f and g are given. Evaluate the expression, if possible. (01) (8.8) (3) (s)) (q) (0) (f.8) (D)
Tables for the functions f and g are given. Evaluate the expression, if possible. (01) (8.8) (3) (s)) (q) (0) (f.8) (D)
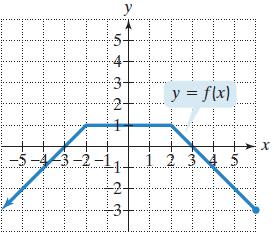
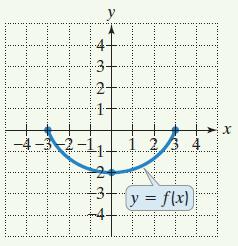
Use the graph of f to determine each of the following. Where applicable, use interval notation.a. The domain of fb. The range of fc. The zeros of fd. F(0)e. Intervals on which f is increasingf. Intervals on which f is decreasingg. Intervals on which f is constanth. Values of x for which f(x) >
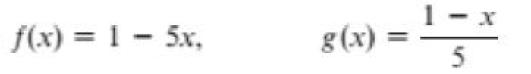
In Exercises 51–66, finda. (f ° g)(x)b. (g ° f)(x)c. (f ° g)(2)f(x) = 3x, g(x) = x - 5
In Exercises 49–58, graph each equation in a rectangular coordinate system.x = 5
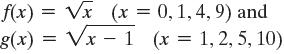
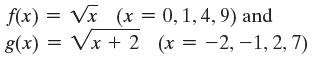
In Exercises 51–54, graph the given square root functions, f and g, in the same rectangular coordinate system. Use the integer values of x given to the right of each function to obtain ordered pairs. Because only nonnegative numbers have square roots that are real numbers, be sure that each graph
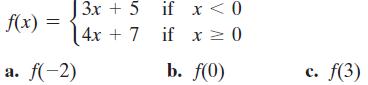
In Exercises 53–58, evaluate each piecewise function at the given values of the independent variable. √3x + 5 4x + 7 f(x) = a. f(-2) if x < 0 if x ≥ 0 b. f(0) c. f(3)
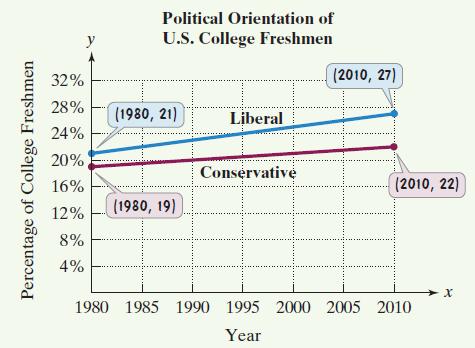
The graph shows the percentage of college freshmen who were liberal or conservative in 1980 and in 2010.a. Find the slope of the line segment representing liberal college freshmen.b. Use your answer from part (a) to complete this statement: For the period shown, the percentage of liberal college
In Exercises 51–54, graph the given square root functions, f and g, in the same rectangular coordinate system. Use the integer values of x given to the right of each function to obtain ordered pairs. Because only nonnegative numbers have square roots that are real numbers, be sure that each graph
In Exercises 53–64, complete the square and write the equation in standard form. Then give the center and radius of each circle and graph the equation. x² + y² + 6x + 2y + 6 = 0
In Exercises 53–66, begin by graphing the standard quadratic function, f(x) = x2. Then use transformations of this graph to graph the given function. g(x)=x²2 - 2
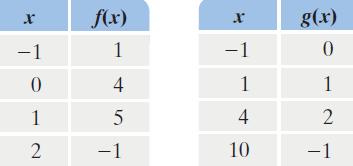
In Exercises 53–58, f and g are defined by the following tables. Use the tables to evaluate each composite function.f(g(1)) X -1 0 1 2 f(x) 1 4 5 -1 X -1 1 4 10 g(x) 0 1 2 -1
In Exercises 53–64, complete the square and write the equation in standard form. Then give the center and radius of each circle and graph the equation. x² + y² + 8x + 4y + 16 = 0
In Exercises 53–66, begin by graphing the standard quadratic function, f(x) = x2. Then use transformations of this graph to graph the given function. g(x) = x² - 1
In Exercises 53–58, f and g are defined by the following tables. Use the tables to evaluate each composite function.f(g(4)) X -1 0 1 2 f(x) 1 4 5 -1 X -1 1 4 10 g(x) 0 1 2 -1
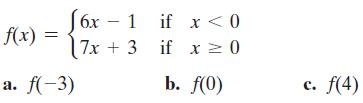
In Exercises 53–58, evaluate each piecewise function at the given values of the independent variable. f(x) = = a. f(-3) 6x 1 7x + 3 if x < 0 if x ≥ 0 b. f(0) c. f(4)
In Exercises 49–58, graph each equation in a rectangular coordinate system.y = 0
Find the average rate of change of f(x) = x2 - 4x from x1 = 5 to x2 = 9.
In Exercises 51–66, finda. (f ° g)(x)b. (g ° f)(x)c. (f ° g)(2)f(x) = x + 4, g(x) = 2x + 1
In Exercises 51–66, finda. (f ° g)(x)b. (g ° f)(x)c. (f ° g)(2)f(x) = 5x + 2, g(x) = 3x - 4
In Exercises 49–58, graph each equation in a rectangular coordinate system.x = 0
In Exercises 55–59, use the graph of y = f(x) to graph each function g.g(x) = f(x + 2) + 3 -4-3 N W 2- 1+ 2+ 2/3 4 y = f(x) X
In Exercises 55–64, use the vertical line test to identify graphs in which y is a function of x. У x
In Exercises 53–66, begin by graphing the standard quadratic function, f(x) = x2. Then use transformations of this graph to graph the given function. (x - 2)² g(x) = (x
In Exercises 53–64, complete the square and write the equation in standard form. Then give the center and radius of each circle and graph the equation. - 0 = 0 - 49 XOT - ₂ + ₂x
Showing 7800 - 7900
of 13634
First
72
73
74
75
76
77
78
79
80
81
82
83
84
85
86
Last
Step by Step Answers