New Semester
Started
Get
50% OFF
Study Help!
--h --m --s
Claim Now
Question Answers
Textbooks
Find textbooks, questions and answers
Oops, something went wrong!
Change your search query and then try again
S
Books
FREE
Study Help
Expert Questions
Accounting
General Management
Mathematics
Finance
Organizational Behaviour
Law
Physics
Operating System
Management Leadership
Sociology
Programming
Marketing
Database
Computer Network
Economics
Textbooks Solutions
Accounting
Managerial Accounting
Management Leadership
Cost Accounting
Statistics
Business Law
Corporate Finance
Finance
Economics
Auditing
Tutors
Online Tutors
Find a Tutor
Hire a Tutor
Become a Tutor
AI Tutor
AI Study Planner
NEW
Sell Books
Search
Search
Sign In
Register
study help
mathematics
college algebra
College Algebra 12th edition Margaret L. Lial, John Hornsby, David I. Schneider, Callie Daniels - Solutions
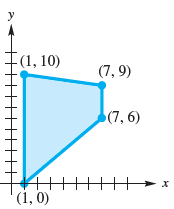
Find the maximum and minimum values of each objective function over the region of feasible solutions shown at the right.objective function = 3x + 5y I(1, 10) (7, 9) (7, 6) НН (1, 0) х
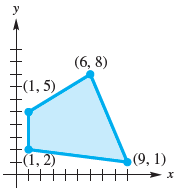
The graphs show regions of feasible solutions. Find the maximum and minimum values of each objective function.objective function = 6x + y y (6, 8) -(1, 5) |(1, 2) (9, 1)
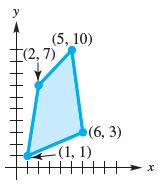
The graphs show regions of feasible solutions. Find the maximum and minimum values of each objective function.objective function = 3x + 5y y (5, 10) E(2, 7) (6, 3) -(1, 1) HIH|||
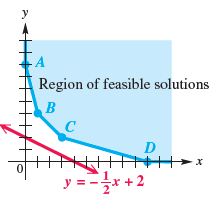
The figure shows the region of feasible solutions for the vitamin problem of Example 5 and the straight-line graph of all combinations of capsules and chewable tablets for which the cost is $0.40.(a) The cost function is 10x + 20y. Give the linear equation (in slope-intercept form) of the line of
Write a system of inequalities for which the graph is the region in the first quadrant inside and including the circle with radius 2 centered at the origin, and above (not including) the line that passes through the points (0, -1) and (2, 2).
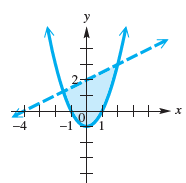
Determine the system of inequalities illustrated in the graph. Write each inequality in standard form. y -4
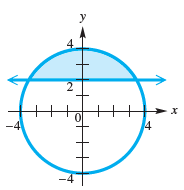
Determine the system of inequalities illustrated in the graph. Write each inequality in standard form. y х -4 14
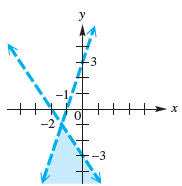
Determine the system of inequalities illustrated in each graph. Write each inequality in standard form. -3
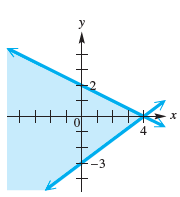
Determine the system of inequalities illustrated in each graph. Write each inequality in standard form. y х -3
Use the shading capabilities of a graphing calculator to graph each inequality or system of inequalities.y ≥ |x + 2|y ≤ 6
Use the shading capabilities of a graphing calculator to graph each inequality or system of inequalities.x + y ≥ 2x + y ≤ 6
Use the shading capabilities of a graphing calculator to graph each inequality or system of inequalities.y ≤ x2 + 5
Use the shading capabilities of a graphing calculator to graph each inequality or system of inequalities.3x + 2y ≥ 6
Graph the solution set of the system of inequalities.y ≤ x3 - xy > -3
Graph the solution set of the system of inequalities.y > x3 + 1y ≥ -1
Graph the solution set of the system of inequalities.e-x - y ≤ 1x - 2y ≥ 4
Graph the solution set of the system of inequalities.y ≤ log xy ≥ |x - 2|
Graph the solution set of the system of inequalities.ln x - y ≥ 1x2 - 2x - y ≤ 1
Graph the solution set of the system of inequalities. х Уs y2 4 2.
Graph the solution set of the system of inequalities.y ≥ 3xy ≥ 2
Graph the solution set of the system of inequalities.2x + 3y ≤ 122x + 3y > -63x + y < 4x ≥ 0y ≥ 0
Graph the solution set of the system of inequalities.2y + x ≥ -5y ≤ 3 + xx ≤ 0y ≤ 0
Graph the solution set of the system of inequalities.x ≤ 4x ≥ 0y ≥ 0
Graph the solution set of the system of inequalities.x + y ≤ 4x - y ≤ 54x + y ≤ -4
Graph the solution set of each system of inequalities.-2 < x < 2y > 1x - y > 0
Graph the solution set of each system of inequalities.-2 < x < 3-1 ≤ y ≤ 52x + y < 6
Graph the solution set of each system of inequalities.3x - 2y ≥ 6x + y ≤ -5y ≤ 4
Graph the solution set of each system of inequalities.x ≥ 0x + y ≤ 42x + y ≤ 5
Graph the solution set of the system of inequalities.y ≥ x2 + 4x + 4y < -x2
Graph the solution set of the system of inequalities.y ≥ (x - 2)2 + 3y ≤ -(x - 1)2 + 6
Graph the solution set of the system of inequalities.x + y ≤ 36-4 ≤ x ≤ 4
Graph the solution set of the system of inequalities.x - y < 1-1 < y < 1
Graph the solution set of the system of inequalities.y ≤ (x + 2)2y ≥ -2x2
Graph the solution set of the system of inequalities.x + y ≤ 9x ≥ -y2
Graph the solution set of the system of inequalities.x + 2y ≤ 4y ≥ x2 - 1
Graph the solution set of the system of inequalities.y ≤ -x2y ≥ x2 - 6
Graph the solution set of the system of inequalities.4x - 3y ≤ 12y ≤ x2
Graph the solution set of the system of inequalities.y ≤ xx2 + y2 < 1
Graph the solution set of the system of inequalities.3x + 5y ≤ 15x - 3y ≥ 9
Graph the solution set of the system of inequalities.4x + 3y < 12y + 4x 7 -4
Graph the solution set of each system of inequalities.2x + y > 2x - 3y < 6
Graph the solution set of the system of inequalities.x + y ≤ 4x - 2y ≥ 6
Graph the solution set of each system of inequalities.x + y ≥ 02x - y ≥ 3
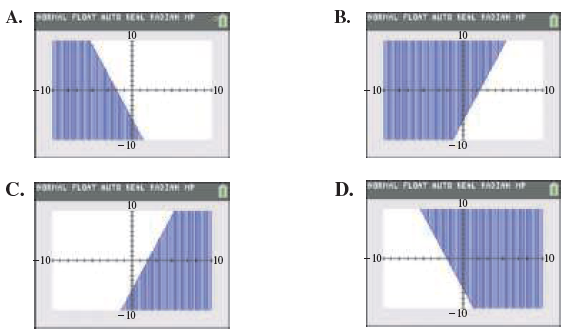
Match the inequality with the appropriate calculator graph in A–D. Do not use a calculator.y ≥ -3x - 6 B. SORTAL PLOAT sUTR E AIA A. iPLOAT TR IEHE FADIAH 10 10 F10 10 --10 10 - 10 D. ORAL PLOAT UTR EL FAIA H C. oAU PLOAT UTR EE FAIA H 10 10 10 10 10 - 10 - 10
Match the inequality with the appropriate calculator graph in A–D. Do not use a calculator.y ≤ -3x - 6 B. SORTAL PLOAT sUTR E AIA A. iPLOAT TR IEHE FADIAH 10 10 F10 10 --10 10 - 10 D. ORAL PLOAT UTR EL FAIA H C. oAU PLOAT UTR EE FAIA H 10 10 10 10 10 - 10 - 10
Match each inequality with the appropriate calculator graph in A–D. Do not use a calculator.y ≥ 3x - 6 B. SORTAL PLOAT sUTR E AIA A. iPLOAT TR IEHE FADIAH 10 10 F10 10 --10 10 - 10 D. ORAL PLOAT UTR EL FAIA H C. oAU PLOAT UTR EE FAIA H 10 10 10 10 10 - 10 - 10
Match each inequality with the appropriate calculator graph in A–D. Do not use a calculator.y ≤ 3x - 6 B. SORTAL PLOAT sUTR E AIA A. iPLOAT TR IEHE FADIAH 10 10 F10 10 --10 10 - 10 D. ORAL PLOAT UTR EL FAIA H C. oAU PLOAT UTR EE FAIA H 10 10 10 10 10 - 10 - 10
Write the inequality that represents the region inside a circle with center (-5, -2) and radius 4.
Work the problem.Which one of the following is a description of the graph of the inequality (x - 5)2 + (y - 2)2 < 4?A. the region inside a circle with center (-5, -2) and radius 2B. the region inside a circle with center (5, 2) and radius 2C. the region inside a circle with center (-5, -2) and
Work the problem.For Ax + By ≥ C, if B < 0, would the region above or below the line be shaded?
Work the problem.For Ax + By ≥ C, if B > 0, would the region above or below the line be shaded?
Graph the inequality.y ≤ log(x - 1) - 2
Graph the inequality.y > 2x + 1
Graph the inequality.(x - 4)2 + y2 ≥ 9
Graph the inequality.x2 + (y + 3)2 ≤ 16
Graph the inequality.y > 2(x + 3)2 - 1
Graph the inequality.y > (x - 1)2 + 2
Graph the inequality.y ≤ x2 - 4
Graph the inequality.y < 3x2 + 2
Graph the inequality.y ≤ -2
Graph the inequality.x ≤ 3
Graph the inequality.2x > 3 - 4y
Graph the inequality.5x < 4y - 2
Graph the inequality.x < 3 + 2y
Graph the inequality.3x - 5y > 6
Graph the inequality.4y - 3x ≤ 5
Graph each inequality.2x + 3y ≥ 4
Graph each inequality.x - y ≥ 2
Graph the inequality.x + 2y ≤ 6
Fill in the blank(s) to correctly complete the sentence, or answer the question.When the inequality in Exercise 9 is solved for y, the result is ______, and the points ________/(above/below) the boundary line are shaded.
Fill in the blank(s) to correctly complete the sentence, or answer the question.The graph of 4x - 7y < 28 has a _______/ (solid/dashed) boundary line.
Fill in the blank(s) to correctly complete the sentence, or answer the question.Does the point (3, -8) satisfy the system in Exercise 7?
ill in the blank(s) to correctly complete the sentence, or answer the question.What are the coordinates of the point of intersection of the boundary lines in the following system?x ≥ 2y ≤ -5
Fill in the blank(s) to correctly complete the sentence, or answer the question.Any point that lies on the graph of -3x - 4y = 12 __________/(does/does not) lie on the graph of -3x - 4y > 12.
Fill in the blank(s) to correctly complete the sentence, or answer the question.The test point (0, 0) _________/ (does/does not) satisfy the inequality -3x - 4y ≥ 12.
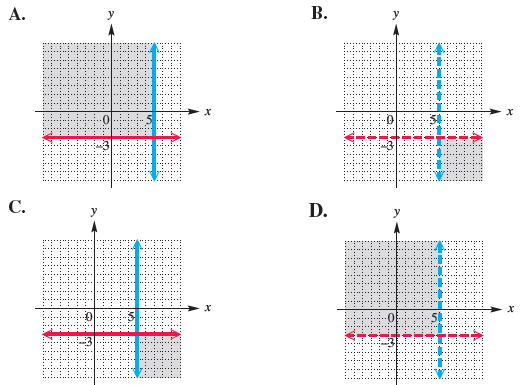
Match each system of inequalities with the correct graph from choices A–D.x < 5y > -3 B. A. : : :: : : : : C. D. . . a. %23
Match each system of inequalities with the correct graph from choices A–D.x > 5y < -3 B. A. : : :: : : : : C. D. . . a. %23
Match each system of inequalities with the correct graph from choices A–D.x ≤ 5y ≥ -3 B. A. : : :: : : : : C. D. . . a. %23
Match each system of inequalities with the correct graph from choices A–D.x ≥ 5y ≤ -3 B. A. : : :: : : : : C. D. . . a. %23
Consider ƒ(x) = ax, where a > 1. Work these exercises in order.If the point (p, q) is on the graph of ƒ, then the point ________ is on the graph of ƒ-1.
Consider ƒ(x) = ax, where a > 1. Work these exercises in order.If a = e, what is the equation for y = ƒ-1(x)? (You need not solve for y.)
Consider ƒ(x) = ax, where a > 1. If a = 10, what is the equation for y = ƒ-1(x)? (You need not solve for y.)
Consider ƒ(x) = ax, where a > 1. If ƒ-1 exists, find an equation for y = ƒ-1(x). (You need not solve for y.)
Consider ƒ(x) = ax, where a > 1. If ƒ has an inverse function ƒ-1, sketch ƒ and ƒ-1 on the same set of axes.
Consider ƒ(x) = ax, where a > 1. Work the exercise in order.Is ƒ a one-to-one function? If so, what kind of related function exists for ƒ?
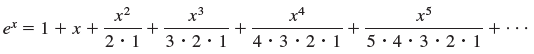
In calculus, the following can be shown.Using more terms, one can obtain a more accurate approximation for ex.Use the terms shown, and replace x with -0.05 to approximate e-0.05 to four decimal places. Check the result with a calculator. x3 x2 et = 1+x + 3· 2· 1 4· 3· 2· 1 5· 4: 3· 2· 1
In calculus, the following can be shown.Using more terms, one can obtain a more accurate approximation for ex.Use the terms shown, and replace x with 1 to approximate e1 = e to three decimal places. Check the result with a calculator. x3 x2 et = 1+x + 3· 2· 1 4· 3· 2· 1 5· 4: 3· 2· 1
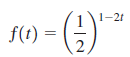
Use properties of exponents to write each function in the form ƒ(t) = kat, where k is a constant. 1-21 f(t) =
Use properties of exponents to write each function in the form ƒ(t) = kat, where k is a constant. 1-2t f(t) = 3
Use properties of exponents to write each function in the form ƒ(t) = kat, where k is a constant. ƒ(t) = 23t+2
Use properties of exponents to write each function in the form ƒ(t) = kat, where k is a constant.
Give an equation of the form ƒ(x) = ax to define the exponential function whose graph contains the given point.(-2, 36)
Give an equation of the form ƒ(x) = ax to define the exponential function whose graph contains the given point.(-3, 64)
Give an equation of the form ƒ(x) = ax to define the exponential function whose graph contains the given point.(3, 125)
Give an equation of the form ƒ(x) = ax to define the exponential function whose graph contains the given point.(3, 8)
If ƒ(x) = ax and ƒ(3) = 27, determine each function value.(a) ƒ(1) (b) ƒ(-1) (c) ƒ(2) (d) ƒ(0)
A function of the form ƒ(x) = xr, where r is a constant, is a power function. Discuss the difference between an exponential function and a power function.
Use a graphing calculator to find the solution set of each equation. Approximate the solution(s) to the nearest tenth.x = 2x
Use a graphing calculator to find the solution set of each equation. Approximate the solution(s) to the nearest tenth.3x + 2 = 4x
Use a graphing calculator to find the solution set of each equation. Approximate the solution(s) to the nearest tenth.6-x = 1 - x
Showing 13000 - 13100
of 16373
First
124
125
126
127
128
129
130
131
132
133
134
135
136
137
138
Last
Step by Step Answers