New Semester
Started
Get
50% OFF
Study Help!
--h --m --s
Claim Now
Question Answers
Textbooks
Find textbooks, questions and answers
Oops, something went wrong!
Change your search query and then try again
S
Books
FREE
Study Help
Expert Questions
Accounting
General Management
Mathematics
Finance
Organizational Behaviour
Law
Physics
Operating System
Management Leadership
Sociology
Programming
Marketing
Database
Computer Network
Economics
Textbooks Solutions
Accounting
Managerial Accounting
Management Leadership
Cost Accounting
Statistics
Business Law
Corporate Finance
Finance
Economics
Auditing
Tutors
Online Tutors
Find a Tutor
Hire a Tutor
Become a Tutor
AI Tutor
AI Study Planner
NEW
Sell Books
Search
Search
Sign In
Register
study help
mathematics
essentials of statistics
Essentials Of Statistics For The Behavioral Sciences 3rd Edition Susan A. Nolan - Solutions
Ratner and Miller (2001) wondered whether people are uncomfortable when they act in a way that’s not obviously in their own self-interest. They randomly assigned 33 women and 32 men to read a fictional passage saying that federal funding would soon be cut for research into a gastrointestinal
In a study of racism, Nail, Harton, and Decker (2003) had participants read a scenario in which a police officer assaulted a motorist. Half the participants read about an African American officer who assaulted a European American motorist, and half read about a European American officer who
A researcher wondered about the degree to which age was a factor for those posting personal ads on Match.com. He randomly selected 200 ads and examined data about the posters (the people who posted the ads). Specifically, for each ad, he calculated the difference between the poster’s age and the
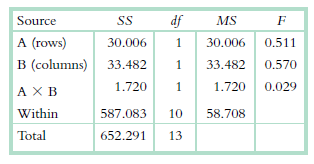
Using the information in the source table provided here, compute R2values for each effect. Using Cohen€™s conventions, explain what these values mean. SS df MS Source A (rows) 30.006 30.006 0.511 B (columns) 33.482 33.482 0.570 1.720 1.720 0.029 AX B Within 587.083 10 58.708 Total 652.291
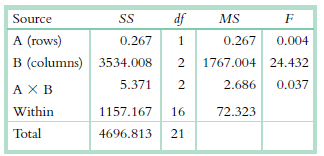
Using the information in the source table provided here, compute R2values for each effect. Using Cohen€™s conventions, explain what these values mean. df Source SS MS A (rows) 0.267 0.267 0.004 B (columns) 3534.008 1767.004 24.432 5.371 2.686 0.037 AXB Within 1157.167 16 72.323 Total
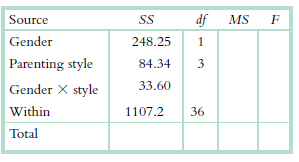
Using what you know about the expanded source table, fill in the missing values in the table shown here: df Source SS MS Gender 248.25 Parenting style 84.34 33.60 Gender X style Within 1107.2 36 Total 1.
Use these data—incidents of reports of underage drinking—to perform the following:“Dry” campus, state school: 47, 52, 27, 50“Dry” campus, private school: 25, 33, 31“Wet” campus, state school: 77, 61, 55, 48“Wet” campus, private school: 52, 68, 60a. Calculate the cell and
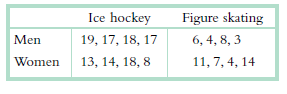
Use these €œenjoyment€ data to perform the following:a. Calculate the cell and marginal means.b. Draw a bar graph.c. Calculate the five different degrees of freedom, and indicate the critical F value based on each set of degrees of freedom, assuming the p level is 0.01.d.
What is a four-way within-groups ANOVA?
What is a factor?
What is a two-way ANOVA?
Explain why the standard error for the distribution of sample means is smaller than the standard deviation of sample scores.
How is the calculation of standard error different for a t test than for a z test?
Why do we modify the formula for calculating standard deviation when using t tests (and divide by N − 1)?
When should we use a t distribution?
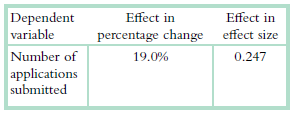
Caroline Hoxby and Sarah Turner (2013) conducted an experiment to determine whether a simple intervention could increase the number of college applications among low-income students. The intervention consisted of information about the college application process and about college costs that were
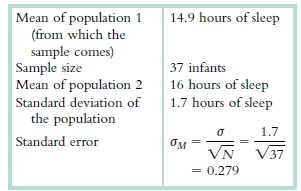
The table below provides information about hours of sleep.a. Calculate statistical power for a one-tailed test (a = 0.05, or 5%) aimed at determining if those in the sample sleep fewer hours, on average, than those in the population.b. Recalculate statistical power with alpha of 0.01, or 1%.
Your roommate is reading Fantasyland: A Season on Baseball’s Lunatic Fringe (Walker, 2006) and is intrigued by the statistical methods used by competitors in fantasy baseball leagues (in which competitors select a team of baseball players from across all major league teams, winning in the fantasy
The research paper on culturally targeted therapy described in Exercise 8.59 reported the following: Across all 76 studies, the random effects weighted average effect size was d = .45 (SE = .04, p < .0001), with a 95% confidence interval of d = .36 to d = .53. The data consisted of 72 nonzero
A meta-analysis examined studies that compared two types of mental health treatments for ethnic and racial minorities—the standard available treatments and treatments that were adapted to the clients’ cultures (Griner & Smith, 2006). An excerpt from the abstract follows:Many previous
A New York Times article reported on the growing problem of homelessness among families (Bellafante, 2013). The reporter wrote that families in a city-run program called Homebase had shorter stays than families not in the program—a difference of about 22.6 fewer nights in a shelter. However, the
Calculate statistical power based on the data presented in Exercise 8.55 using the following alpha levels in a one-tailed test:a. Alpha of 0.05, or 5%b. Alpha of 0.10, or 10%c. Explain how power is affected by alpha in these calculations.
In several exercises in this chapter, we considered the study of one week of a college football season, during which the population of 53 FBS games had a mean spread (winning score minus losing score) of 16.189, with a standard deviation of 12.128. The sample of 4 games that were played that week
As in the previous exercise, assume the average speed of a serve in women’s tennis is around 118 mph, with a standard deviation of 12 mph. But now we recruit only 26 amateur tennis players to use our method. Again, after 6 months we calculate a group mean of 123 mph.a. Using a 95% confidence
Let’s assume the average speed of a serve in women’s tennis is around 118 mph, with a standard deviation of 12 mph. We recruit 100 amateur tennis players to use our new training method this time, and after 6 months we calculate a group mean of 123 mph.a. Using a 95% confidence interval, test
According to the Nielsen Company, Americans spend $345 million on chocolate during the week of Valentine’s Day. Let’s assume that we know the average married person spends $45, with a population standard deviation of $16. In February 2009, the U.S. economy was in the throes of a recession.
In Exercise 8.51, you calculated an effect size for data from one week of a 2006 college football season with 4 games. Imagine that you had a sample of 20 games. How would the effect size change? Explain why it would or would not change.In Exercise 4.51we considered the study of one week of a 2006
In Exercises 8.49 and 8.50, we considered the study of one week of a 2006 college football season, during which the population of 53 FBS games had a mean spread (winning score minus losing score) of 16.189, with a standard deviation of 12.128. The sample of 4 games that were played that week in the
Using the football data presented in Exercise 8.49, practice evaluating data using confidence intervals.a. Compute the 80% confidence interval.b. How do the conclusion and the confidence interval change as you move from 95% confidence to 80% confidence?c. Why don’t we talk about having 100%
In an exercise in Chapter 7, we asked whether college football teams tend to be more likely or less likely to be mismatched in the upper National Collegiate Athletic Association (NCAA) divisions. During one week of a college football season, the population of 53 Football Bowl Subdivision (FBS)
Let’s assume the average speed of a serve in men’s tennis is around 135 mph, with a standard deviation of 6.5 mph. Because these statistics are calculated over many years and many players, we will treat them as population parameters. We develop a new training method that will increase arm
What is the difference between a between- groups research design and a within-groups research design?
Showing 200 - 300
of 232
1
2
3
Step by Step Answers