New Semester
Started
Get
50% OFF
Study Help!
--h --m --s
Claim Now
Question Answers
Textbooks
Find textbooks, questions and answers
Oops, something went wrong!
Change your search query and then try again
S
Books
FREE
Study Help
Expert Questions
Accounting
General Management
Mathematics
Finance
Organizational Behaviour
Law
Physics
Operating System
Management Leadership
Sociology
Programming
Marketing
Database
Computer Network
Economics
Textbooks Solutions
Accounting
Managerial Accounting
Management Leadership
Cost Accounting
Statistics
Business Law
Corporate Finance
Finance
Economics
Auditing
Tutors
Online Tutors
Find a Tutor
Hire a Tutor
Become a Tutor
AI Tutor
AI Study Planner
NEW
Sell Books
Search
Search
Sign In
Register
study help
mathematics
precalculus 1st
Precalculus 1st Edition Jay Abramson - Solutions
For the following exercises, find the inverse of the functions. f(x)=√2x+1
For the following exercises, plot the complex numbers on the complex plane.−3 − 4i
For the following exercises, determine the end behavior of the functions. f(x) = x4
For the following exercises, write an equation describing the relationship of the given variables.y varies jointly as x, z, and w and when x = 1, z = 2, w = 5, then y = 100.
For the following exercises, find the domain, vertical asymptotes, and horizontal asymptotes of the functions. f(x)= = x+5 x²-25
For the following exercises, determine whether there is a minimum or maximum value to each quadratic function. Find the value and the axis of symmetry.f(x) = 4x2 + x − 1
For the following exercises, use the Factor Theorem to find all real zeros for the given polynomial function and one factor.f(x) = 2x3 + 3x2 + x + 6; x + 2
For the following exercises, use synthetic division to find the quotient.(4x3 − 12x2 − 5x − 1) ÷ (2x + 1)
For the following exercises, find the x- or t-intercepts of the polynomial functions.f(x) = 2x3 − x2 − 8x + 4
For the following exercises, perform the indicated operation and express the result as a simplified complex number.(3 + 2i) + (5 − 3i)
For the following exercises, find the inverse of the functions. f(x)=√3-4x
For the following exercises, determine the end behavior of the functions. f(x) = x3
For the following exercises, write an equation describing the relationship of the given variables.y varies jointly as the square of x and the square of z and when x = 3 and z = 4, then y = 72.
For the following exercises, find the domain, vertical asymptotes, and horizontal asymptotes of the functions. f(x) = x 4 9-x
For the following exercises, determine whether there is a minimum or maximum value to each quadratic function. Find the value and the axis of symmetry.h(t) = −4t2 + 6t − 1
For the following exercises, determine end behavior of the polynomial function. f(x) = 2x²(1 + 3x - x²)
For the following exercises, use the Factor Theorem to find all real zeros for the given polynomial function and one factor.f(x) = −5x3 + 16x2 − 9; x − 3
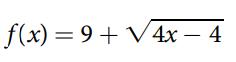
For the following exercises, find the inverse of the functions. f(x)=9+√4x - 4
For the following exercises, perform the indicated operation and express the result as a simplified complex number.(−2 − 4i) + (1 + 6i)
For the following exercises, determine the end behavior of the functions. f(x) = −x4
For the following exercises, write an equation describing the relationship of the given variables.y varies jointly as x and the square root of z and when x = 2 and z = 25, then y = 100.
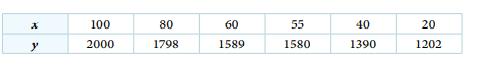
For the following exercises, use each set of data to calculate the regression line using a calculator or other technology tool, and determine the correlation coefficient to 3 decimal places of accuracy. X y 100 2000 80 1798 60 1589 55 1580 40 1390 20 1202
In 2004, a school population was 1250. By 2012 the population had dropped to 875. Assume the population is changing linearly.a. How much did the population drop between the year 2004 and 2012?b. What is the average population decline per year?c. Find an equation for the population, P, of the school
For the following exercises, given each set of information, find a linear equation satisfying the conditions, if possible.f(−5) = −4, and f(5) = 2
For the following exercises, consider this scenario: The number of people afflicted with the common cold in the winter months steadily decreased by 205 each year from 2005 until 2010. In 2005, 12,025 people were afflicted.In what year will the number of people be 9,700?
For the following exercises, consider this scenario: In 2000, the moose population in a park was measured to be 6,500. By 2010, the population was measured to be 12,500. Assume the population continues to change linearly. Find a formula for the moose population, P.
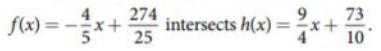
For the following exercises, use the descriptions of each pair of lines given below to find the slopes of Line 1 and Line 2. Is each pair of lines parallel, perpendicular, or neither?Use algebra to find the point at which the line f(x)=x+ 274 25 intersects h(x)=2x+ 73 10 °
For the following exercises, given each set of information, find a linear equation satisfying the conditions, if possible.(2, 4) and (4, 10)
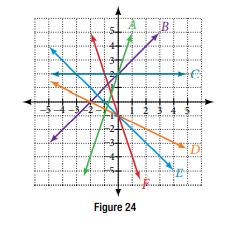
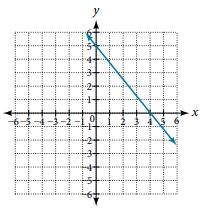
For the following exercises, match the given linear equation with its graph in Figure 24.f(x) = −1/2 x − 1 where 4- -32 pogg B gg nggan dingings ng Figure 24 DI
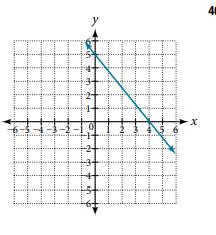
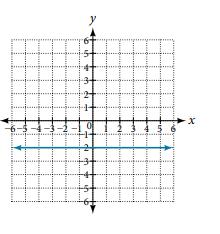
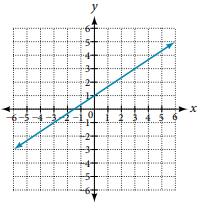
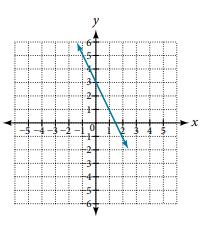
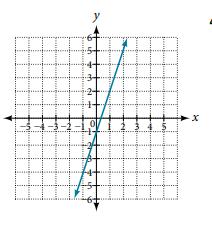
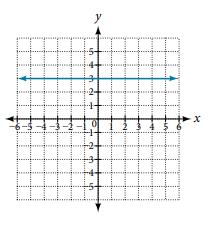
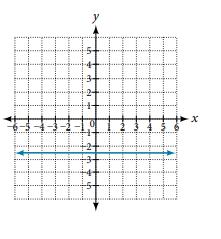
For the following exercises, find the slope of the lines graphed. # --6-5 10 # ... x 4
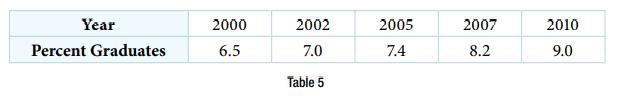
For the following exercises, consider the data in Table 5, which shows the percent of unemployed in a city of people 25 years or older who are college graduates is given below, by year.In what year will the percentage exceed 12%? Year Percent Graduates 2000 6.5 2002 7.0 Table
For the following exercises, consider this scenario: The profit of a company increased steadily over a ten-year span. The following ordered pairs show the number of units sold in hundreds and the profit in thousands of over the ten-year span, (number of units sold, profit) for specific recorded
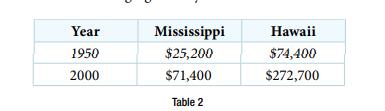
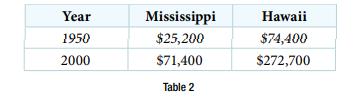
For the following exercises, use the median home values in Mississippi and Hawaii (adjusted for inflation) shown in Table 2. Assume that the house values are changing linearly.In which state have home values increased at a higher rate? Year 1950 2000 Mississippi $25,200 $71,400 Table
For the following exercises, find the slope of the lines graphed. 6-5-4-3 wale ·2+ 10 # 4 5 x
For the following exercises, sketch a line with the given features.An x-intercept of (−2, 0) and y-intercept of (0, 4)
For the following exercises, consider this scenario: The profit of a company increased steadily over a ten-year span. The following ordered pairs show the number of units sold in hundreds and the profit in thousands of over the ten-year span, (number of units sold, profit) for specific recorded
For the following exercises, use the median home values in Mississippi and Hawaii (adjusted for inflation) shown in Table 2. Assume that the house values are changing linearly.If these trends were to continue, what would be the median home value in Mississippi in 2010?
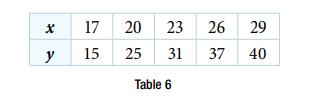
Based on the set of data given in Table 6, calculate the regression line using a calculator or other technology tool, and determine the correlation coefficient to three decimal places. X y 17 15 20 25 23 26 29 31 37 40 Table 6
For the following exercises, write an equation for the lines graphed. --6-5-4- ak IN 34 5
For the following exercises, sketch a line with the given features.A y-intercept of (0, 7) and slope −3/2
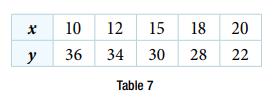
Based on the set of data given in Table 7, calculate the regression line using a calculator or other technology tool, and determine the correlation coefficient to three decimal places. X y 10 12 15 36 34 30 Table 7 18 28 20 22
For the following exercises, use the median home values in Mississippi and Hawaii (adjusted for inflation) shown in Table 2. Assume that the house values are changing linearly.If we assume the linear trend existed before 1950 and continues after 2000, the two states’ median house values will be
For the following exercises, consider this scenario: The profit of a company decreased steadily over a ten-year span. The following ordered pairs show dollars and the number of units sold in hundreds and the profit in thousands of over the ten-year span (number of units sold, profit) for specific
For the following exercises, write an equation for the lines graphed. # --6-5-4 -3-2- T y 0 g |||| x
For the following exercises, sketch a line with the given features.A y-intercept of (0, 3) and slope 2/5
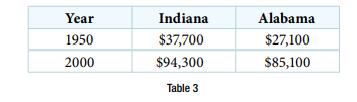
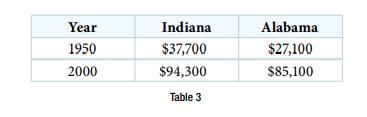
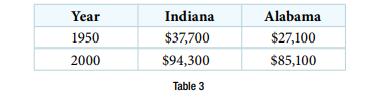
For the following exercises, use the median home values in Indiana and Alabama (adjusted for inflation) shown in Table 3. Assume that the house values are changing linearly.In which state have home values increased at a higher rate? Year 1950 2000 Indiana $37,700 $94,300 Table
For the following exercises, consider this scenario: The profit of a company decreased steadily over a ten-year span. The following ordered pairs show dollars and the number of units sold in hundreds and the profit in thousands of over the ten-year span (number of units sold, profit) for specific
For the following exercises, consider this scenario: The population of a city increased steadily over a ten-year span. The following ordered pairs show the population and the year over the ten-year span (population, year) for specific recorded years:(3,600, 2000); (4,000, 2001); (4,700, 2003);
For the following exercises, write an equation for the lines graphed. tutustuot -5-4-3-2- m 1
For the following exercises, sketch a line with the given features.Passing through the points (−6, −2) and (6, −6)
For the following exercises, use the median home values in Indiana and Alabama (adjusted for inflation) shown in Table 3. Assume that the house values are changing linearly.If these trends were to continue, what would be the median home value in Indiana in 2010?
For the following exercises, consider this scenario: The population of a city increased steadily over a ten-year span. The following ordered pairs show the population and the year over the ten-year span (population, year) for specific recorded years:(3,600, 2000); (4,000, 2001); (4,700, 2003);
For the following exercises, write an equation for the lines graphed. ger 3- -X x
For the following exercises, sketch a line with the given features.Passing through the points (−3, −4) and (3, 0)
For the following exercises, use the median home values in Indiana and Alabama (adjusted for inflation) shown in Table 3. Assume that the house values are changing linearly. If we assume the linear trend existed before 1950 and continues after 2000, the two states’ median house values will
For the following exercises, consider this scenario: The population of a city increased steadily over a ten-year span. The following ordered pairs show the population and the year over the ten-year span (population, year) for specific recorded years:(3,600, 2000); (4,000, 2001); (4,700, 2003);
For the following exercises, write an equation for the lines graphed. x 100 mas 9 $1 Sp fram 34 -24 24 LE ngine -
For the following exercises, sketch the graph of each equation. f(x) = −2x − 1
For the following exercises, consider this scenario: The population of a city increased steadily over a ten-year span. The following ordered pairs show the population and the year over the ten-year span (population, year) for specific recorded years:(3,600, 2000); (4,000, 2001); (4,700, 2003);
In 2004, a school population was 1,001. By 2008 the population had grown to 1,697. Assume the population is changing linearly.a. How much did the population grow between the year 2004 and 2008?b. How long did it take the population to grow from 1,001 students to 1,697 students?c. What is the
For the following exercises, write an equation for the lines graphed. 5-4-3-2 x
For the following exercises, sketch the graph of each equation.g(x) = −3x + 2
In 2003, a town’s population was 1,431. By 2007 the population had grown to 2,134. Assume the population is changing linearly.a. How much did the population grow between the year 2003 and 2007?b. How long did it take the population to grow from 1,431 people to 2,134 people?c. What is the average
For the following exercises, sketch the graph of each equation.h(x) = 1/3 x + 2
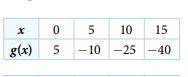
For the following exercises, which of the tables could represent a linear function? For each that could be linear, find a linear equation that models the data. 0 g(x) 5 * תי 5 10 15 -10-25-40 un
A phone company has a monthly cellular plan where a customer pays a flat monthly fee and then a certain amount of money per minute used on the phone. If a customer uses 410 minutes, the monthly cost will be $71.50. If the customer uses 720 minutes, the monthly cost will be $118.a. Find a linear
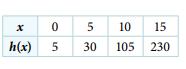
For the following exercises, which of the tables could represent a linear function? For each that could be linear, find a linear equation that models the data. x h(x) 5 10 0 5 30 105 15 230
For the following exercises, sketch the graph of each equation.k(x) = 2/3 x − 3
A phone company has a monthly cellular data plan where a customer pays a flat monthly fee of $10 and then a certain amount of money per megabyte (MB) of data used on the phone. If a customer uses 20 MB, the monthly cost will be $11.20. If the customer uses 130 MB, the monthly cost will be $17.80.a.
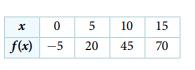
For the following exercises, which of the tables could represent a linear function? For each that could be linear, find a linear equation that models the data. x 0 f(x) – 5 -5 5 20 10 45 15 70
For the following exercises, sketch the graph of each equation.f(t) = 3 + 2t
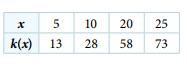
For the following exercises, which of the tables could represent a linear function? For each that could be linear, find a linear equation that models the data. 5 k(x) 13 * 10 28 20 58 25 73
In 1991, the moose population in a park was measured to be 4,360. By 1999, the population was measured again to be 5,880. Assume the population continues to change linearly.a. Find a formula for the moose population, P since 1990.b. What does your model predict the moose population to be in
For the following exercises, sketch the graph of each equation.p(t) = −2 + 3t
In 2003, the owl population in a park was measured to be 340. By 2007, the population was measured again to be 285. The population changes linearly. Let the input be years since 1990.a. Find a formula for the owl population, P. Let the input be years since 2003.b. What does your model predict the
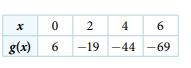
For the following exercises, which of the tables could represent a linear function? For each that could be linear, find a linear equation that models the data. x 0 2 4 6 -19 -44 g(x) 6 -69
For the following exercises, sketch the graph of each equation.x = 3
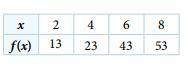
For the following exercises, which of the tables could represent a linear function? For each that could be linear, find a linear equation that models the data. x 2 f(x) 13 4 23 6 43 8 53
For the following exercises, sketch the graph of each equation.x = −2
Suppose the world’s oil reserves in 2014 are 1,820 billion barrels. If, on average, the total reserves are decreasing by 25 billion barrels of oil each year:a. Give a linear equation for the remaining oil reserves, R, in terms of t, the number of years since now.b. Seven years from now, what will
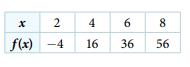
For the following exercises, which of the tables could represent a linear function? For each that could be linear, find a linear equation that models the data. X 2 4 16 f(x) -4 6 8 36 56 00
For the following exercises, sketch the graph of each equation.q(x) = 3
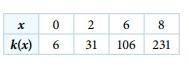
For the following exercises, which of the tables could represent a linear function? For each that could be linear, find a linear equation that models the data. * k(x) 00 0 2 6 8 6 31 106 231
You are choosing between two different prepaid cell phone plans. The first plan charges a rate of 26 cents per minute. The second plan charges a monthly fee of $19.95 plus 11 cents per minute. How many minutes would you have to use in a month in order for the second plan to be preferable?
For the following exercises, sketch the graph of each equation.4x = −9y + 36
You are choosing between two different window washing companies. The first charges $5 per window. The second charges a base fee of $40 plus $3 per window. How many windows would you need to have for the second company to be preferable?
If f is a linear function, f(0.1) = 11.5, and f(0.4) = −5.9, find an equation for the function.
For the following exercises, sketch the graph of each equation.x/3 − y/4 = 1
When hired at a new job selling jewelry, you are given two pay options: • Option A: Base salary of $17,000 a year with a commission of 12% of your sales• Option B: Base salary of $20,000 a year with a commission of 5% of your sales How much jewelry would you need to sell for option A
Graph the function f on a domain of [−10, 10]: f(x) = 0.02x − 0.01. Enter the function in a graphing utility. For the viewing window, set the minimum value of x to be −10 and the maximum value of x to be 10.
For the following exercises, sketch the graph of each equation.3x − 5y = 15
When hired at a new job selling electronics, you are given two pay options: • Option A: Base salary of $14,000 a year with a commission of 10% of your sales • Option B: Base salary of $19,000 a year with a commission of 4% of your sales How much electronics would you need to sell
Graph the function f on a domain of [−10, 10]: f(x) = 2,500x + 4,000
For the following exercises, sketch the graph of each equation.3x = 15
When hired at a new job selling electronics, you are given two pay options: • Option A: Base salary of $20,000 a year with a commission of 12% of your sales • Option B: Base salary of $26,000 a year with a commission of 3% of your salesHow much electronics would you need to sell for
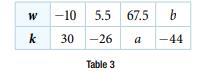
Table 3 shows the input, w, and output, k, for a linear function k. a. Fill in the missing values of the table. b. Write the linear function k, round to 3 decimal places. w -10 -10 k 30 5.5 67.5 b -26 a -44 Table 3
For the following exercises, sketch the graph of each equation.3y = 12
When hired at a new job selling electronics, you are given two pay options:• Option A: Base salary of $10,000 a year with a commission of 9% of your sales • Option B: Base salary of $20,000 a year with a commission of 4% of your sales How much electronics would you need to sell for option
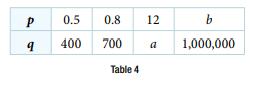
Table 4 shows the input, p, and output, q, for a linear function q. a. Fill in the missing values of the table. b. Write the linear function k. P 9 0.5 0.8 400 700 Table 4 12 a b 1,000,000
If g(x) is the transformation of f(x) = x after a vertical compression by 3/4, a shift right by 2, and a shift down by 4a. Write an equation for g(x).b. What is the slope of this line?c. Find the y-intercept of this line.
Showing 7500 - 7600
of 8578
First
69
70
71
72
73
74
75
76
77
78
79
80
81
82
83
Last
Step by Step Answers