New Semester
Started
Get
50% OFF
Study Help!
--h --m --s
Claim Now
Question Answers
Textbooks
Find textbooks, questions and answers
Oops, something went wrong!
Change your search query and then try again
S
Books
FREE
Study Help
Expert Questions
Accounting
General Management
Mathematics
Finance
Organizational Behaviour
Law
Physics
Operating System
Management Leadership
Sociology
Programming
Marketing
Database
Computer Network
Economics
Textbooks Solutions
Accounting
Managerial Accounting
Management Leadership
Cost Accounting
Statistics
Business Law
Corporate Finance
Finance
Economics
Auditing
Tutors
Online Tutors
Find a Tutor
Hire a Tutor
Become a Tutor
AI Tutor
AI Study Planner
NEW
Sell Books
Search
Search
Sign In
Register
study help
mathematics
precalculus 1st
Precalculus 1st Edition Jay Abramson - Solutions
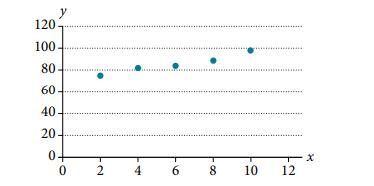
Draw a best-fit line for the plotted data. 120 100 80 60 40 20. 0 0 2 4 6 8 10 12 X
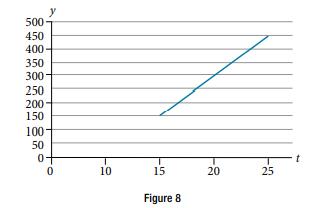
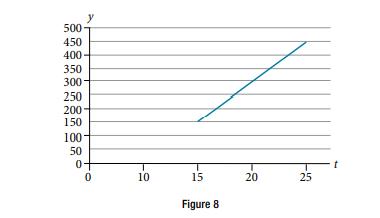
For the following exercises, use the graph in Figure 8, which shows the profit, y, in thousands of dollars, of a company in a given year, t, where t represents the number of years since 1980. Find and interpret the x-intercept. y 500 450 400 350 300- 250 200 150 100 50 0 0 10 15 Figure
For the following exercises, given each set of information, find a linear equation satisfying the conditions, if possible.x-intercept at (−5, 0) and y-intercept at (0, 4)
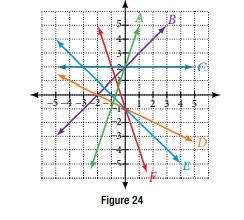
For the following exercises, match the given linear equation with its graph in Figure 24.f(x) = 3x + 2 F 4-1 22 4 Figure 24
For the following exercises, consider this scenario: The population of a city increased steadily over a ten-year span. The following ordered pairs shows the population and the year over the ten-year span, (population, year) for specific recorded years:(2500, 2000), (2650, 2001), (3000, 2003),
For the following exercises, find the slope of the lines graphed. # Luojus --6-5-4- y gunay
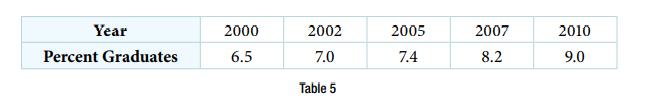
For the following exercises, consider the data in Table 5, which shows the percent of unemployed in a city of people 25 years or older who are college graduates is given below, by year. Determine whether the trend appears to be linear. If so, and assuming the trend continues, find a linear
For the following exercises, use the graph in Figure 8, which shows the profit, y, in thousands of dollars, of a company in a given year, t, where t represents the number of years since 1980.Find and interpret the slope. 500 450 400- 350 300 250 200 150 100- 50 0 0 10 15 Figure 8 20 25
For the following exercises, consider this scenario: The population of a city increased steadily over a ten-year span. The following ordered pairs shows the population and the year over the ten-year span, (population, year) for specific recorded years:(2500, 2000), (2650, 2001), (3000, 2003),
For the following exercises, sketch a line with the given features. An x-intercept of (−4, 0) and y-intercept of (0, −2)
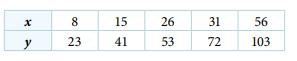
For the following exercises, use each set of data to calculate the regression line using a calculator or other technology tool, and determine the correlation coefficient to 3 decimal places of accuracy. x y 8 23 15 41 26 53 31 72 56 103
For the following exercises, consider this scenario: The number of people afflicted with the common cold in the winter months steadily decreased by 205 each year from 2005 until 2010. In 2005, 12,025 people were afflicted.Find the linear function that models the number of people inflicted with the
A town’s population increases at a constant rate. In 2010 the population was 55,000. By 2012 the population had increased to 76,000. If this trend continues, predict the population in 2016.
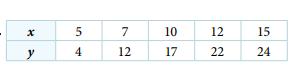
For the following exercises, use each set of data to calculate the regression line using a calculator or other technology tool, and determine the correlation coefficient to 3 decimal places of accuracy. x y 51 4 7 12 10 17 12 22 15 24
For the following exercises, use the descriptions of each pair of lines given below to find the slopes of Line 1 and Line 2. Is each pair of lines parallel, perpendicular, or neither?Write an equation for a line parallel to g(x) = 3x − 1 and passing through the point (4, 9).
For the following exercises, find the slope of the line that passes through the two given points.(2, 4) and (4, 10)
For the following exercises, consider this scenario: The number of people afflicted with the common cold in the winter months steadily decreased by 205 each year from 2005 until 2010. In 2005, 12,025 people were afflicted.Find a reasonable domain and range for the function C.
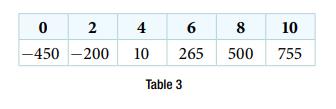
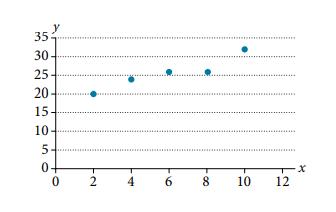
Draw a scatter plot for the data provided in Table 3. Then determine whether the data appears to be linearly related. 02 4 6 -450-200 10 265 Table 3 8 500 10 755
he number of people afflicted with the common cold in the winter months dropped steadily by 50 each year since 2004 until 2010. In 2004, 875 people were inflicted. Find the linear function that models the number of people afflicted with the common cold C as a function of the year, t. When will no
For the following exercises, use the descriptions of each pair of lines given below to find the slopes of Line 1 and Line 2. Is each pair of lines parallel, perpendicular, or neither?Write an equation for a line perpendicular to h(t) = −2t + 4 and passing through the point (−4, −1).
For the following exercises, use each set of data to calculate the regression line using a calculator or other technology tool, and determine the correlation coefficient to 3 decimal places of accuracy.
For the following exercises, find the slope of the line that passes through the two given points.(1, 5) and (4, 11)
For the following exercises, consider this scenario: The number of people afflicted with the common cold in the winter months steadily decreased by 205 each year from 2005 until 2010. In 2005, 12,025 people were afflicted.If the function C is graphed, find and interpret the x-and y-intercepts.
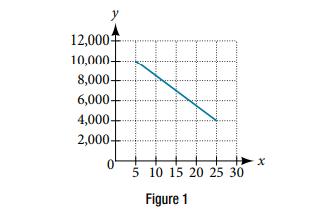
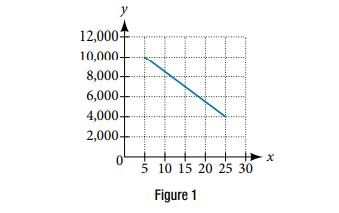
For the following exercises, use the graph in Figure 1 showing the profit, y, in thousands of dollars, of a company in a given year, x, where x represents years since 1980.Find the linear function y, where y depends on x, the number of years since 1980.
Draw a best-fit line for the plotted data. 35: 30 25. 20 15 10- 5 0. 0 -N 2 ****** 4 6 8 *************** 10 12 x
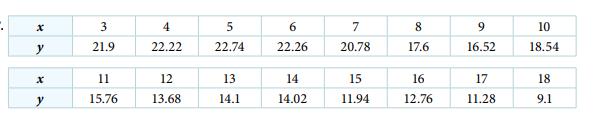
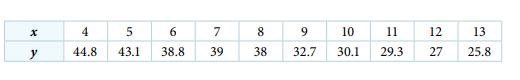
For the following exercises, use each set of data to calculate the regression line using a calculator or other technology tool, and determine the correlation coefficient to 3 decimal places of accuracy. X y 4 44.8 5 43.1 6 38.8 7 39 8 9 10 11 38 32.7 30.1 29.3 12 27 13 25.8
For the following exercises, use the descriptions of each pair of lines given below to find the slopes of Line 1 and Line 2. Is each pair of lines parallel, perpendicular, or neither?Write an equation for a line perpendicular to p(t) = 3t + 4 and passing through the point (3, 1).
For the following exercises, use the graph in Figure 1 showing the profit, y, in thousands of dollars, of a company in a given year, x, where x represents years since 1980.Find and interpret the y-intercept. y 12,000- 10,000- 8,000- 6,000- 4,000- 2,000- 0 + x 5 10 15 20 25 30 Figure 1
For the following exercises, find the slope of the line that passes through the two given points.(−1, 4) and (5, 2)
For the following exercises, consider this scenario: The number of people afflicted with the common cold in the winter months steadily decreased by 205 each year from 2005 until 2010. In 2005, 12,025 people were afflicted.If the function C is graphed, find and interpret the slope of the function.
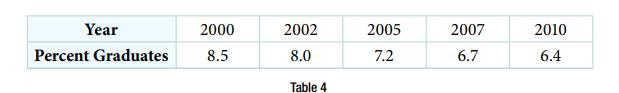
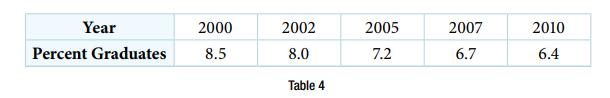
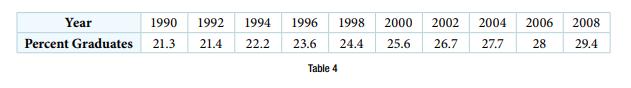
For the following exercises, use Table 4 which shows the percent of unemployed persons 25 years or older who are college graduates in a particular city, by year. Determine whether the trend appears linear. If so, and assuming the trend continues, find a linear regression model to predict the
For the following exercises, use the descriptions of each pair of lines given below to find the slopes of Line 1 and Line 2. Is each pair of lines parallel, perpendicular, or neither?Find the point at which the line f(x) = −2x − 1 intersects the line g(x) = −x.
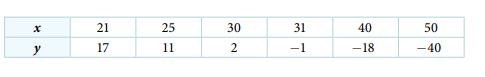
For the following exercises, use each set of data to calculate the regression line using a calculator or other technology tool, and determine the correlation coefficient to 3 decimal places of accuracy. * y 21 17 25 11 30 2 31 -1 40 -18 50
For the following exercises, find the slope of the line that passes through the two given points.(8, −2) and (4, 6)
For the following exercises, consider this scenario: The number of people afflicted with the common cold in the winter months steadily decreased by 205 each year from 2005 until 2010. In 2005, 12,025 people were afflicted.When will the output reach 0?
For the following exercise, consider this scenario: In 2004, a school population was 1,700. By 2012 the population had grown to 2,500.Assume the population is changing linearly.a. How much did the population grow between the year 2004 and 2012?b. What is the average population growth per year?c.
For the following exercises, use Table 4 which shows the percent of unemployed persons 25 years or older who are college graduates in a particular city, by year.In what year will the percentage drop below 4%? Year Percent Graduates 2000 8.5 2002 8.0 Table 4 2005 7.2 2007 6.7 2010 6.4
For the following exercises, use the descriptions of each pair of lines given below to find the slopes of Line 1 and Line 2. Is each pair of lines parallel, perpendicular, or neither?Find the point at which the line f(x) = 2x + 5 intersects the line g(x) = −3x − 5.
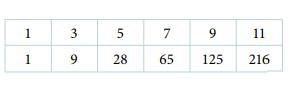
For the following exercises, draw a scatter plot for the data provided. Does the data appear to be linearly related? 1 1 لا 3 9 5 28 الا 7 65 9 125 11 216
For the following exercises, find the slope of the line that passes through the two given points.(6, 11) and (−4, 3)
Let h(t) be the height above ground, in feet, of a rocket t seconds after launching. Explain the meaning of each statement: a. h(1) = 200b. h(2) = 350
Explain how to find the output variable in a word problem that uses a linear function.
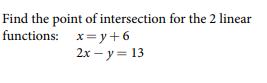
For the following exercises, use the descriptions of the pairs of lines to find the slopes of Line 1 and Line 2. Is each pair of lines parallel, perpendicular, or neither? Find the point of intersection for the 2 linear functions: x=y+6 2x – y=13
For the following exercises, use the descriptions of each pair of lines given below to find the slopes of Line 1 and Line 2. Is each pair of lines parallel, perpendicular, or neither?Line 1: Passes through (−8, −55) and (10, 89)Line 2: Passes through (9, −44) and (4, −14)
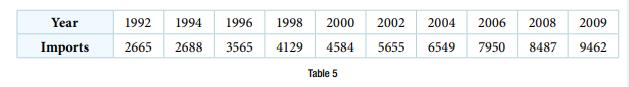
The U.S. import of wine (in hectoliters) for several years is given in Table 5. Determine whether the trend appears linear. If so, and assuming the trend continues, in what year will imports exceed 12,000 hectoliters? Year Imports 1994 1996 1992 2665 2688 1998 2000 2002 2004 2006 4584 5655 6549
For the following exercises, use the descriptions of each pair of lines given below to find the slopes of Line 1 and Line 2. Is each pair of lines parallel, perpendicular, or neither?Line 1: Passes through (0, 5) and (3, 3)Line 2: Passes through (1, −5) and (3, −2)
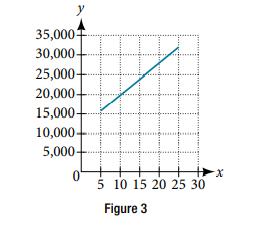
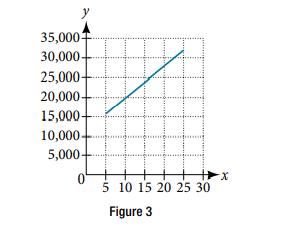
For the following exercises, use the graph in Figure 3, showing the profit, y, in thousands of dollars, of a company in a given year, x, where x represents years since 1980. Find the linear function y , where y depends on x, the number of years since 1980.
The number of people afflicted with the common cold in the winter months dropped steadily by 25 each year since 2002 until 2012. In 2002, 8,040 people were inflicted. Find the linear function that models the number of people afflicted with the common cold C as a function of the year, t. When will
For the following exercises, determine whether each function is increasing or decreasing.p(x) = 1/4 x − 5
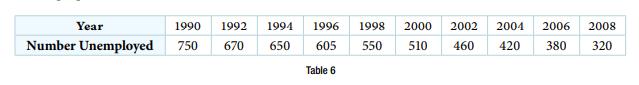
Table 6 shows the year and the number of people unemployed in a particular city for several years. Determine whether the trend appears linear. If so, and assuming the trend continues, in what year will the number of unemployed reach 5 people? Year Number Unemployed 1990 1992 1994 1996 650 605 750
For the following exercises, consider this scenario: The weight of a newborn is 7.5 pounds. The baby gained one-half pound a month for its first year.When did the baby weight 10.4 pounds?
For the following exercises, use the descriptions of the pairs of lines to find the slopes of Line 1 and Line 2. Is each pair of lines parallel, perpendicular, or neither? A car rental company offers two plans for renting a car. Plan A: 25 dollars per day and 10 cents per mile Plan B: 50
For the following exercises, use the descriptions of each pair of lines given below to find the slopes of Line 1 and Line 2. Is each pair of lines parallel, perpendicular, or neither?Line 1: Passes through (2, 5) and (5, −1)Line 2: Passes through (−3, 7) and (3, −5)
For the following exercises, determine whether each function is increasing or decreasing.n(x) = −1/3 x − 2
For the following exercises, consider this scenario: The weight of a newborn is 7.5 pounds. The baby gained one-half pound a month for its first year.What is the output when the input is 6.2? Interpret your answer.
For the following exercises, use the graph in Figure 3, showing the profit, y, in thousands of dollars, of a company in a given year, x, where x represents years since 1980.Find and interpret the y-intercept. 35,000 30,000- 25,000- 20,000- 15,000- 10,000- 5,000 0 5 10 15 20 25 30 Figure 3 X
Find the area of a triangle bounded by the y-axis, the line f(x) = 10 − 2x, and the line perpendicular to f that passes through the origin.
For the following exercises, use the descriptions of each pair of lines given below to find the slopes of Line 1 and Line 2. Is each pair of lines parallel, perpendicular, or neither?Write an equation for a line parallel to f(x) = −5x − 3 and passing through the point (2, −12).
For the following exercises, determine whether each function is increasing or decreasing.m(x) = −3/8 x + 3
For the following exercises, consider this scenario: The weight of a newborn is 7.5 pounds. The baby gained one-half pound a month for its first year.If the function W is graphed, find and interpret the slope of the function.
The U.S. Census tracks the percentage of persons 25 years or older who are college graduates. That data for several years is given in Table 4[14]. Determine whether the trend appears linear. If so, and assuming the trend continues, in what year will the percentage exceed 35%? Year 1990
For the following exercises, determine whether each function is increasing or decreasing.j(x) = 1/2 x − 3
A town’s population increases at a constant rate. In 2010 the population was 65,000. By 2012 the population had increased to 90,000. Assuming this trend continues, predict the population in 2018.
For the following exercises, use the descriptions of each pair of lines given below to find the slopes of Line 1 and Line 2. Is each pair of lines parallel, perpendicular, or neither?Line 1: Passes through (1, 7) and (5, 5)Line 2: Passes through (−1, −3) and (1, 1)
For the following exercises, use the descriptions of the pairs of lines to find the slopes of Line 1 and Line 2. Is each pair of lines parallel, perpendicular, or neither? Sketch a graph of the linear function f(t) = 2t − 5.
For the following exercises, consider this scenario: The weight of a newborn is 7.5 pounds. The baby gained one-half pound a month for its first year.If the function W is graphed, find and interpret the x- and y-intercepts.
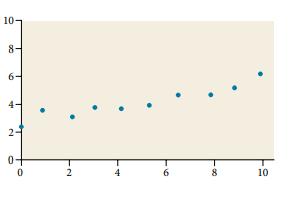
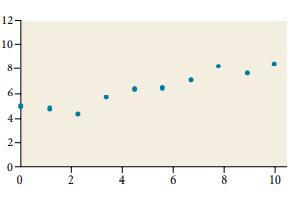
For the following exercises, draw a best-fit line for the plotted data. 10- 8 6. 4 2 0- 0 2 6 8 10
For the following exercises, determine whether each function is increasing or decreasing.k(x) = −4x + 1
Find the area of a triangle bounded by the y-axis, the line f(x) = 12 − 4x, and the line perpendicular to f that passes through the origin.
For the following exercises, use the descriptions of each pair of lines given below to find the slopes of Line 1 and Line 2. Is each pair of lines parallel, perpendicular, or neither? Line 1: Passes through (2, 3) and (4, −1)Line 2: Passes through (6, 3) and (8, 5)
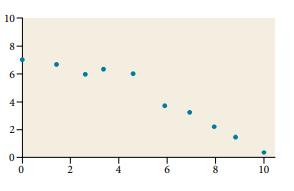
For the following exercises, draw a best-fit line for the plotted data. 10- 8- 4- 2- 0 2 T+ 6 8 10
For the following exercises, use the descriptions of the pairs of lines to find the slopes of Line 1 and Line 2. Is each pair of lines parallel, perpendicular, or neither? Find the equation of a line with a y-intercept of (0, 2) and slope −1/2.
For the following exercises, consider this scenario: The weight of a newborn is 7.5 pounds. The baby gained one-half pound a month for its first year.Find a reasonable domain and range for the function W.
For the following exercises, determine whether each function is increasing or decreasing.h(x) = −2x + 4
A car rental company offers two plans for renting a car. Plan A: $25 per day and $0.10 per mile.Plan B: $40 per day with free unlimited mileage How many miles would you need to drive for plan B to save you money?
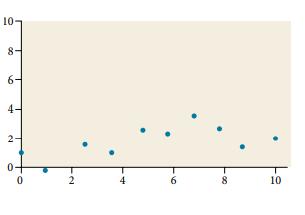
For the following exercises, draw a best-fit line for the plotted data. 10- 8- 00 6- 4- N 0 2 6 10
For the following exercises, use the descriptions of the pairs of lines to find the slopes of Line 1 and Line 2. Is each pair of lines parallel, perpendicular, or neither? Write an equation for a line perpendicular to f(x) = 5x − 1 and passing through the point (5, 20).
For the following exercises, consider this scenario: The weight of a newborn is 7.5 pounds. The baby gained one-half pound a month for its first year.Find the linear function that models the baby’s weight, W, as a function of the age of the baby, in months, t.
For the following exercises, determine whether each function is increasing or decreasing.b(x) = 8 − 3x
For the two linear functions, find the point of intersection: x = y + 22x − 3y = −1
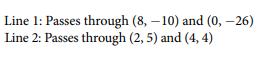
For the following exercises, use the descriptions of the pairs of lines to find the slopes of Line 1 and Line 2. Is each pair of lines parallel, perpendicular, or neither? Line 1: Passes through (8,-10) and (0, -26) Line 2: Passes through (2, 5) and (4,4)
For the following exercises, use the descriptions of each pair of lines given below to find the slopes of Line 1 and Line 2. Is each pair of lines parallel, perpendicular, or neither? Line 1: Passes through (0, 6) and (3, −24)Line 2: Passes through (−1, 19) and (8, −71)
For the following exercises, draw a best-fit line for the plotted data. 12- 10- 00 6- 4. 2 0 0 2 6 8 10
For the following exercises, consider this scenario: A town has an initial population of 75,000. It grows at a constant rate of 2,500 per year for 5 years.What is the output in the year 12 years from the onset of the model?
For the following exercises, determine whether each function is increasing or decreasing.a(x) = 5 − 2x
For the following exercises, use the descriptions of the pairs of lines to find the slopes of Line 1 and Line 2. Is each pair of lines parallel, perpendicular, or neither? Line 1: Passes through (5, 11) and (10, 1) Line 2: Passes through (-1, 3) and (-5, 11)
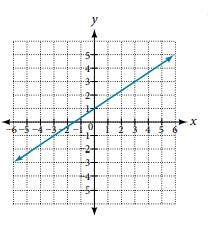
Graph of the linear function f(x) = −x + 6 .
For the following exercises, find the x- and y-intercepts of each equation.7x + 2y = 56
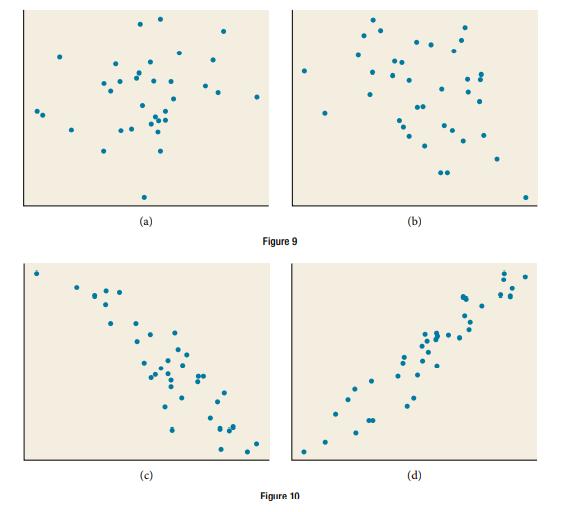
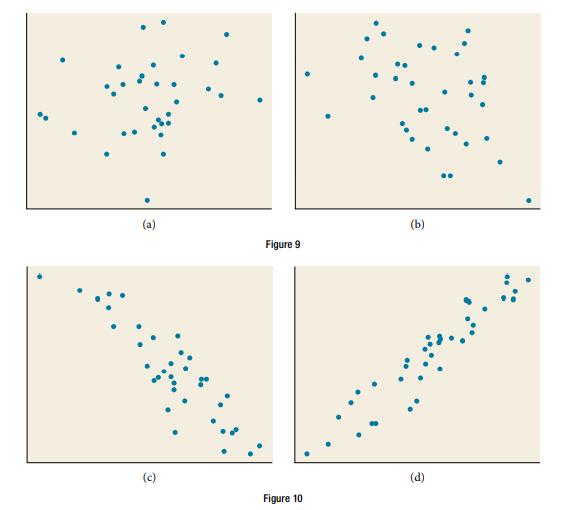
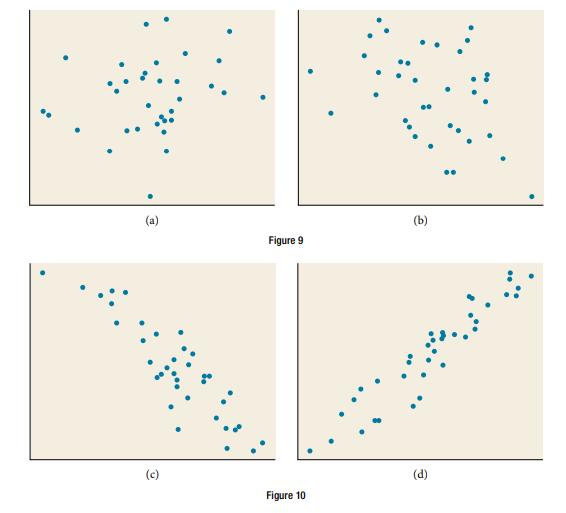
For the following exercises, match each scatterplot with one of the four specified correlations in Figure 9 and Figure 10.r = −0.39 (a) (c) Figure 9 Figure 10 (b) (d) ..
For the following exercises, consider this scenario: A town has an initial population of 75,000. It grows at a constant rate of 2,500 per year for 5 years.When will the output reached 100,000?
For the following exercises, determine whether each function is increasing or decreasing.g(x) = 5x + 6
Sketch a line with a y-intercept of (0, 5) and slope −5/2.
For the following exercises, find the x- and y-intercepts of each equation.−2x + 5y = 20
For the following exercises, find the x- and y-intercepts of the given equation.f(x) = 2x − 1
For the following exercises, consider this scenario: A town has an initial population of 75,000. It grows at a constant rate of 2,500 per year for 5 years.If the function P is graphed, find and interpret the slope of the function.
For the following exercises, match each scatterplot with one of the four specified correlations in Figure 9 and Figure 10.r = 0.26 (a) Figure 9 Figure 10 (b) (d)
For the following exercises, determine whether each function is increasing or decreasing.f(x) = 4x + 3
Write an equation for a line perpendicular to f(x) = 4x + 3 and passing through the point (8, 10)
For the following exercises, find the x- and y-intercepts of each equation.k(x) = −5x + 1
For the following exercises, match each scatterplot with one of the four specified correlations in Figure 9 and Figure 10.r = −0.89 (a) (c) Figure 9 Figure 10 (b) (d)
Showing 7800 - 7900
of 8578
First
72
73
74
75
76
77
78
79
80
81
82
83
84
85
86
Step by Step Answers