New Semester
Started
Get
50% OFF
Study Help!
--h --m --s
Claim Now
Question Answers
Textbooks
Find textbooks, questions and answers
Oops, something went wrong!
Change your search query and then try again
S
Books
FREE
Study Help
Expert Questions
Accounting
General Management
Mathematics
Finance
Organizational Behaviour
Law
Physics
Operating System
Management Leadership
Sociology
Programming
Marketing
Database
Computer Network
Economics
Textbooks Solutions
Accounting
Managerial Accounting
Management Leadership
Cost Accounting
Statistics
Business Law
Corporate Finance
Finance
Economics
Auditing
Tutors
Online Tutors
Find a Tutor
Hire a Tutor
Become a Tutor
AI Tutor
AI Study Planner
NEW
Sell Books
Search
Search
Sign In
Register
study help
mathematics
precalculus 1st
Precalculus 1st Edition Jay Abramson - Solutions
For the following exercises, find functions f(x) and g(x) so the given function can be expressed as h(x) = f(g(x)). h(x) = (x + 2)2
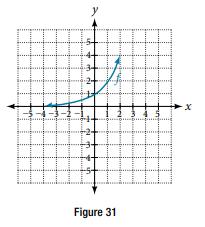
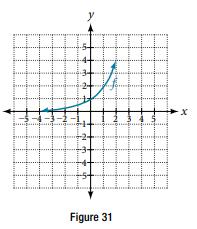
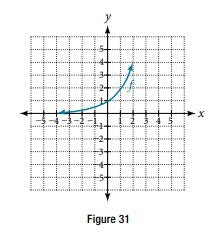
For the following exercises, use the graph of f(x) = 2x shown in Figure 31 to sketch a graph of each transformation of f(x).w(x) = 2x−1 *** -3-1- ggg g for 1 Opp Figure 31 ·x
For the following exercises, find the x- and y-intercepts of the graphs of each function.f(x) = 4|x − 3| + 4
For the following exercises, determine whether the relation represents y as a function of x y3 = x2
Find the domain of the function f(x) = √2x 3− 50x by;a. using algebra. b. graphing the function in the radicand and determining intervals on the x-axis for which the radicand is nonnegative.
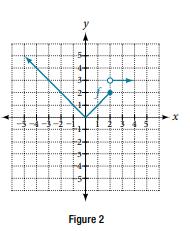
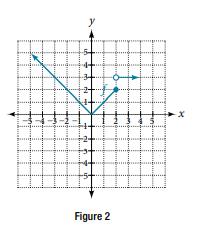
For the following exercises, use the graph of the piecewise function shown in Figure 2. Find f(−2). DIRECT II Figure 2 @ ugning x
For the following exercises, find the average rate of change of the functions from x = 1 to x = 2.f(x) = −2/x2
For the following exercises, sketch a graph of the function as a transformation of the graph of one of the toolkit functions. f(t) = (t + 1)2 −3
For the following exercises, find functions f(x) and g(x) so the given function can be expressed as h(x) = f(g(x)).h(x) = 3/x − 5
For the following exercises, find the x- and y-intercepts of the graphs of each function.f(x) = −2|x +1| + 6
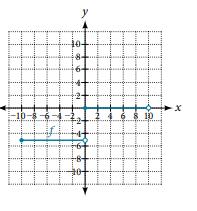
For the following exercises, write the domain and range of each function using interval notation. -H 7 T x
For the following exercises, find the average rate of change of each function on the interval specified.f(x) = x2 on [1, 5]
For the following exercises, sketch a graph of the function as a transformation of the graph of one of the toolkit functions. h(x) = |x − 1| + 4
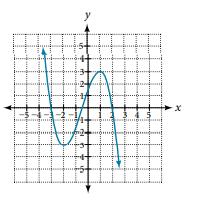
For the following exercises, use the graphs to determine the intervals on which the functions are increasing, decreasing, or constant. 5+ gorize 114in # 34.5 uns #
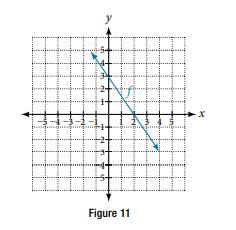
For the following exercises, use the graph of f shown in Figure 11.Solve f−1 (x) = 0. 5-4-3 -1- pom y 2 pump Figure 11
For the following exercises, evaluate the function f at the indicated values f(−3), f(2), f(−a), −f(a), f(a + h). f(x) = −5x2 + 2x − 1
For the following exercises, use the graph of the piecewise function shown in Figure 2. Write an equation for the piecewise function. Figure 2
For the following exercises, find functions f(x) and g(x) so the given function can be expressed as h(x) = f(g(x)).h(x) = 4/(x + 2)2
For the following exercises, evaluate the function f at the indicated values f(−3), f(2), f(−a), −f(a), f(a + h). f(x)=√2-x+5
For the following exercises, solve each inequality and write the solution in interval notation. |x − 2| > 10
For the following exercises, write the domain and range of each function using interval notation. 200 x
For the following exercises, find the average rate of change of each function on the interval specified. h(x) = 5 − 2x2 on [−2, 4]
For the following exercises, sketch a graph of the function as a transformation of the graph of one of the toolkit functions. k(x) = (x − 2)3 − 1
For the following exercises, use the graphs to determine the intervals on which the functions are increasing, decreasing, or constant. H H X.
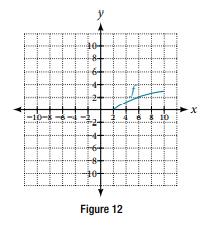
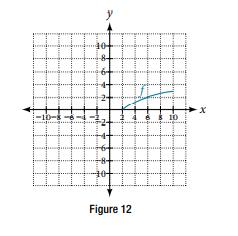
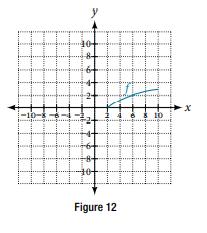
For the following exercises, use the graph of the one-to-one function shown in Figure 12. Sketch the graph of f−1. Amin qu -10-8-6- 40 18+ ndi ளால்பரேராசு -DI mons 10 Figure 12 ம் p x
For the following exercises, find functions f(x) and g(x) so the given function can be expressed as h(x) = f(g(x)). h(x) = 4+ √x
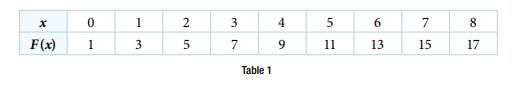
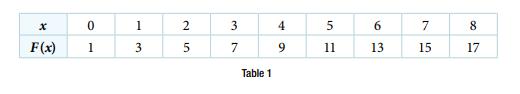
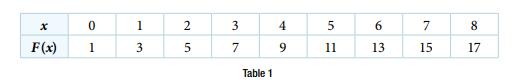
For the following exercises, use the values listed in Table 1. Find F(6). x 0 F(x) 1 1 3 2 10 5 3 N Table 1 4 9 5 11 6 13 7 15 8 17
For the following exercises, write the domain and range of each function using interval notation. NA
For the following exercises, evaluate the function f at the indicated values f(−3), f(2), f(−a), −f(a), f(a + h). f(x) = 6x - 1 5x + 2
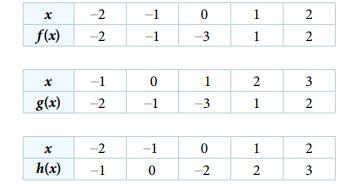
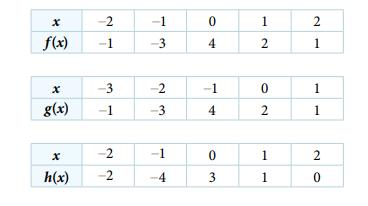
Tabular representations for the functions f, g, and h are given below. Write g(x) and h(x) as transformations of f(x). x f(x) با g(x) x h(x) -2 -2 -1 -2 -2 -1 -1 -1 0 -1 -1 0 0 -3 1 -3 0 -2 1 1 2 1 1 2 2 2 3 نما 2 2 ا نیا 3
For the following exercises, find the average rate of change of each function on the interval specified. g (x) = 3x3 − 1 on [−3, 3]
For the following exercises, use the graphs to determine the intervals on which the functions are increasing, decreasing, or constant.Find the local extrema for the function graphed in Exercise 28. பிரீகோம்ப ராம் D 3.4 mon II
For the following exercises, use the graph of the one-to-one function shown in Figure 12.If the complete graph of f is shown, find the domain of f. nāmsāme 100 10-8-6-1 aguan 40 18+ 17 Q m H -Drap pumpa Figure 12 10 t -X
For the following exercises, evaluate the function f at the indicated values f(−3), f(2), f(−a), −f(a), f(a + h). f(x) = ∣ x − 1∣ − ∣ x + 1∣
For the following exercises, find functions f(x) and g(x) so the given function can be expressed as h(x) = f(g(x)). h(x) (3x² 1 - 4)-³
For the following exercises, use the values listed in Table 1. Is the graph increasing or decreasing on its domain? x 0 F(x) 1 1 3 2 5 3 7 Table 1 4 9 5 11 6 13 7 15 8 17
For the following exercises, write the domain and range of each function using interval notation. LIILI LIA
For the following exercises, solve each inequality and write the solution in interval notation.|x − 4| ≥ 8
For the following exercises, find the average rate of change of each function on the interval specified. y = 1/x on [1, 3]
Tabular representations for the functions f, g, and h are given below. Write g(x) and h(x) as transformations of f(x). X -2 f(x) -1 x -3 g(x) -1 -2 h(x) -2 -1 -3 -2 -3 -1 -4 0 4 -1 4 0 3 1 2 0 2 1 1 2 1 1 1 2 ON 0
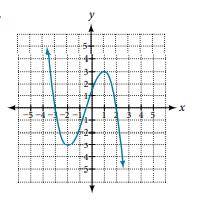
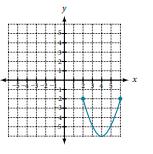
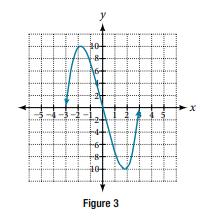
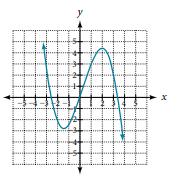
For the following exercises, use the graphs to determine the intervals on which the functions are increasing, decreasing, or constant.For the graph in Figure 3, the domain of the function is [−3, 3]. The range is [−10, 10]. Find the absolute minimum of the function on this interval.
For the following exercises, use the graph of the one-to-one function shown in Figure 12.If the complete graph of f is shown, find the range of f. பா y 40 44 Ha -10-8-8-44 b Obim "p mor 468 10 Sp *** Figure 12
For the following exercises, use the values listed in Table 1.Is the function represented by the graph one-to-one? x 0 F(x) 1 1 3 2 5 3 7 Table 1 4 9 5 11 6 13 7 15 8 17
For the following exercises, find functions f(x) and g(x) so the given function can be expressed as h(x) = f(g(x)). 3x-2 x+5 h(x) = V
For the following exercises, use the graph of each function to estimate the intervals on which the function is increasing or decreasing. x
For the following exercises, solve the equations below and express the answer using set notation.|3x − 2| = 7
For the following exercises, solve each inequality and write the solution in interval notation.|3x − 5| ≥ 13
For the following exercises, determine the interval(s) on which the function is increasing and decreasing. f(x) = 4(x + 1)2 − 5
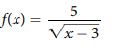
For the following exercises, find the domain of each function using interval notation. f(x) = 5 Vx-3
For the following exercises, determine whether the relation represents y as a function of x x = y3
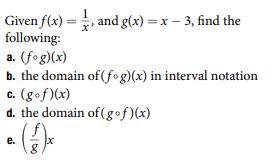
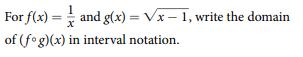
For the following exercises, use each set of functions to find f(g(h(x))). Simplify your answers. Given f(x)=, and g(x) = x - 3, find the following: a. (fog)(x) b. the domain of (fog)(x) in interval notation c. (gof)(x) d. the domain of (gof)(x) e. (1)x
For the following exercises, find the domain of each function, expressing answers using interval notation. f(x) = 2/3x + 2
For the following exercises, use a graphing utility to determine whether each function is one-to-one. f(x) = 3√3x + 1
For the following exercises, use the graph of each function to estimate the intervals on which the function is increasing or decreasing. x y 1
For the following exercises, solve the equations below and express the answer using set notation.|3x − 2| = −7
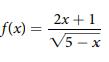
For the following exercises, find the domain of each function using interval notation. f(x) = 2x + 1 V5-x
For the following exercises, determine the interval(s) on which the function is increasing and decreasing.g(x) = 5(x + 3)2 − 2
For the following exercises, determine whether the relation represents y as a function of x y = x3
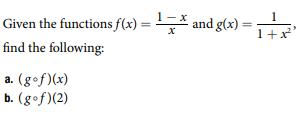
For the following exercises, use each set of functions to find f(g(h(x))). Simplify your answers. Given the functions f(x) = ¹ * and g(x) = x find the following: a. (gof)(x) b. (gof)(2) 1+:
For the following exercises, use a graphing utility to determine whether each function is one-to-one.f(x) = −5x + 1
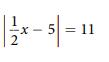
For the following exercises, solve the equations below and express the answer using set notation. ||2x-5=11
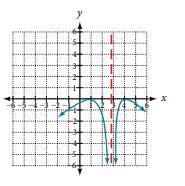
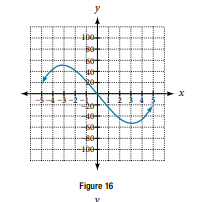
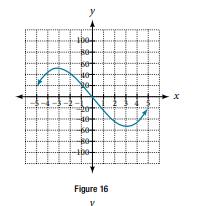
For the following exercises, consider the graph shown in Figure 16. Estimate the intervals where the function is increasing or decreasing. 100- -be Figure 16 V THI X
For the following exercises, determine the interval(s) on which the function is increasing and decreasing. a(x)=√-x+4
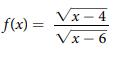
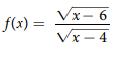
For the following exercises, find the domain of each function using interval notation. f(x) = √x-4 Vx-6
For the following exercises, find the domain of each function, expressing answers using interval notation. f(x) = √x − 6/√x − 4
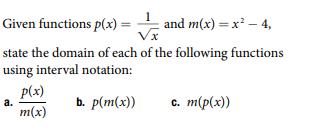
For the following exercises, use each set of functions to find f(g(h(x))). Simplify your answers. Given functions p(x) = and m(x) = x² - 4, state the domain of each of the following functions using interval notation: a. p(x) m(x) b. p(m(x)) c. m(p(x))
For the following exercises, determine whether the relation represents y as a function of x y= V1-x²
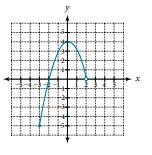
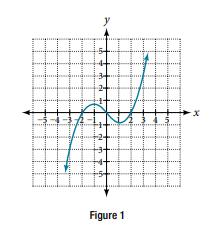
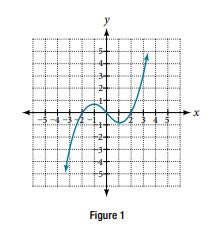
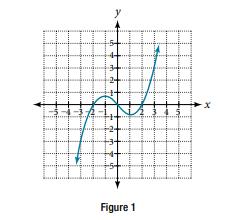
For the following exercises, use the graph of g shown in Figure 1.On what intervals is the function increasing? 3-4- of y Figure 1 p 3 -x
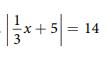
For the following exercises, solve the equations below and express the answer using set notation. -X 3 5 = 14
For the following exercises, consider the graph shown in Figure 16.Estimate the point(s) at which the graph of f has a local maximum or a local minimum. X befo Figure 16 ர CLO 886 பித் 6588 Dr II
For the following exercises, determine whether the relation represents y as a function of x x = ±V1-y
For the following exercises, find the domain of each function using interval notation. f(x) = Vx-6 x-4
For the following exercises, find the average rate of change of the functions from x = 1 to x = 2. f(x) = 4x − 3
For the following exercises, use a graphing utility to determine whether each function is one-to-one. f(x) = x3 − 27
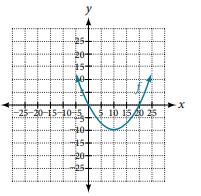
For the following exercises, determine whether the graph represents a one-to-one function. 25+ 20 45+ 30+ -25-20-15-10-15 105 30 35 II LI 5 10 15 20 25 •p.. Ħ ·x
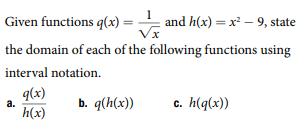
For the following exercises, use each set of functions to find f(g(h(x))). Simplify your answers. Given functions q(x) and h(x)=x²-9, state the domain of each of the following functions using interval notation. a. q(x) h(x) b. q(h(x)) c. h(q(x))
For the following exercises, solve the equations below and express the answer using set notation. -√3x +5/+14=0
For the following exercises, use the graph of f(x) = 2x shown in Figure 31 to sketch a graph of each transformation of f(x).h(x) = 2x − 3 GOE for... anguign g Figure 31 -X
For the following exercises, use the graph of g shown in Figure 1.On what intervals is the function decreasing? 3-4- Figure 1 -x
For the following exercises, use the graph of f(x) = 2x shown in Figure 31 to sketch a graph of each transformation of f(x). g(x) = 2x + 1 Figure 31
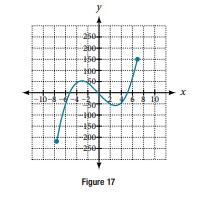
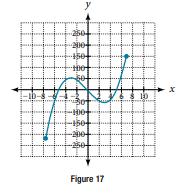
For the following exercises, consider the graph in Figure 17.If the complete graph of the function is shown, estimate the intervals where the function is increasing or decreasing. -1D-3 -200- 105 00 |--100- 150+ -200- Figure 17 10 X
For the following exercises, determine whether the relation represents y as a function of x -y=+V1-x
For the following exercises, find the domain of each function using interval notation. -f(x) = X X ४५१४ X
For the following exercises, determine whether the graph represents a one-to-one function. -10-8-6-4-2. +-6- 4 6 8 10 An
For the following exercises, use each set of functions to find f(g(h(x))). Simplify your answers. For f(x) = of (fog)(x) g(x)=√x-1, write the domain and in interval notation.
For the following exercises, consider the graph in Figure 17.If the complete graph of the function is shown, estimate the absolute maximum and absolute minimum. -10-8- anima y 250 200+ -450+ -100 -100+ +-150+ -200+ 350 Figure 17 10 mg x
For the following exercises, use the graph of g shown in Figure 1.Approximate the local minimum of the function. Express the answer as an ordered pair. LI # 7/5-15- 3- Figure 1 15
For the following exercises, find the x- and y-intercepts of the graphs of each function. f(x) = 2|x +1| − 10
For the following exercises, determine whether the relation represents y as a function of x y2 = x2
What is the difference between a relation and a function?
Describe why the horizontal line test is an effective way to determine whether a function is one-to-one?
How does one find the domain of the quotient of two functions, f/g?
Can the average rate of change of a function be constant?
How do you solve an absolute value equation?
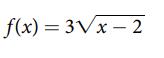
For the following exercises, find the domain of each function using interval notation. f(x)=3√x-2
Why do we restrict the domain of the function f(x) = x2 to find the function’s inverse?
For the following exercises, determine whether the relation is a function.{(5, 2), (6, 1), (6, 2), (4, 8)}
Can a function be its own inverse? Explain.
Are one-to-one functions either always increasing or always decreasing? Why or why not?
For the following exercises, determine whether the relation represents a function.{(a, b), (c, d), (a, c)}
Showing 8300 - 8400
of 8578
First
72
73
74
75
76
77
78
79
80
81
82
83
84
85
86
Step by Step Answers