New Semester
Started
Get
50% OFF
Study Help!
--h --m --s
Claim Now
Question Answers
Textbooks
Find textbooks, questions and answers
Oops, something went wrong!
Change your search query and then try again
S
Books
FREE
Study Help
Expert Questions
Accounting
General Management
Mathematics
Finance
Organizational Behaviour
Law
Physics
Operating System
Management Leadership
Sociology
Programming
Marketing
Database
Computer Network
Economics
Textbooks Solutions
Accounting
Managerial Accounting
Management Leadership
Cost Accounting
Statistics
Business Law
Corporate Finance
Finance
Economics
Auditing
Tutors
Online Tutors
Find a Tutor
Hire a Tutor
Become a Tutor
AI Tutor
AI Study Planner
NEW
Sell Books
Search
Search
Sign In
Register
study help
mathematics
precalculus
Precalculus 9th edition Michael Sullivan - Solutions
In problem, solve each inequality.x2 + x > 12
In problem, graph the function f by starting with the graph of y = x2 and using transformations (shifting, compressing, stretching, and/or reflection).If necessary, write f in the form f(x) = a(x – h)2 + k.]f(x) = 2x2 + 4
In problem, graph the function f by starting with the graph of y = x2 and using transformations (shifting, compressing, stretching, and/or reflection).If necessary, write f in the form f(x) = a(x – h)2 + k.]f(x) = 1/4 x2
In problem, solve each inequality.x2 - 1 < 0
In problem,(a) Graph each quadratic function by determining whether its graph opens up or down and by finding its vertex, axis of symmetry, y-intercept, and x-intercepts, if any.(b) Determine the domain and the range of the function.(c) Determine where the function is increasing and where it is
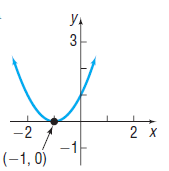
In problem, match each graph to one the following functions.f(x) = x2 + 2x + 2A.B.C.D.E.F.G.H. Ул 3 -2 -1- (-1, 0) У, 2 2 х -2 (-1, –1)
In problem, solve each inequality.x2 - 9 < 0
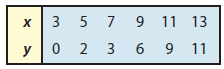
In problem,(a) Draw a scatter diagram.(b) Select two points from the scatter diagram and find the equation of the line containing the points selected.(c) Graph the line found in part (b) on the scatter diagram.(d) Use a graphing utility to find the line of best fit.(e) Use a graphing utility to
In problem, graph each quadratic function using transformations (shifting, compressing, stretching, and/or reflecting).f(x) = -3(x + 2) 2 + 1
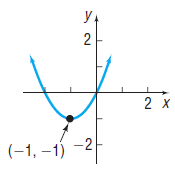
In problem, match each graph to one the following functions.f(x) = x2 - 2xA.B.C.D.E.F.G.H. Ул 3 -2 -1- (-1, 0) У, 2 2 х -2 (-1, –1)
In problem, solve each inequality.x2 + 8x > 0
In problem,(a) Draw a scatter diagram.(b) Select two points from the scatter diagram and find the equation of the line containing the points selected.(c) Graph the line found in part (b) on the scatter diagram.(d) Use a graphing utility to find the line of best fit.(e) Use a graphing utility to
In problem, graph each quadratic function using transformations (shifting, compressing, stretching, and/or reflecting).f(x) = 2(x + 1) 2 + 4
In problem, graph each quadratic function using transformations (shifting, compressing, stretching, and/or reflecting).f(x) = (x -1) 2 – 3
In problem, examine the scatter diagram and determine whether the type of relation is linear or nonlinear. 35 ol 45
In problem, solve each inequality.x2 - 4x > 0
In problem, match each graph to one the following functions.f(x) = x2 + 2xA.B.C.D.E.F.G.H. Ул 3 -2 -1- (-1, 0) У, 2 2 х -2 (-1, –1)
In problem, match each graph to one the following functions.f(x) = x2 - 2x + 2A.B.C.D.E.F.G.H. Ул 3 -2 -1- (-1, 0) У, 2 2 х -2 (-1, –1)
In problem, match each graph to one the following functions.f(x) = x2 + 2x + 1A.B.C.D.E.F.G.H. Ул 3 -2 -1- (-1, 0) У, 2 2 х -2 (-1, –1)
In problem, solve each inequality.x2 + 3x - 10 > 0
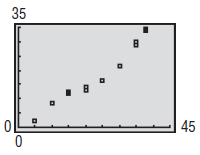
In problem, examine the scatter diagram and determine whether the type of relation is linear or nonlinear. 25 10
In problem, graph each quadratic function using transformations (shifting, compressing, stretching, and/or reflecting).f(x) = -(x - 4) 2
In problem, graph each quadratic function using transformations (shifting, compressing, stretching, and/or reflecting).f(x) = (x +1) 2 – 4
In problem, graph each quadratic function using transformations (shifting, compressing, stretching, and/or reflecting).f(x) = (x - 2)2 + 2
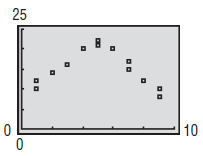
In problem, examine the scatter diagram and determine whether the type of relation is linear or nonlinear. 50 30 20
In problem, solve each inequality.x2 - 3x - 10 < 0
In problem, match each graph to one the following functions.f(x) = x2 - 2x + 1A.B.C.D.E.F.G.H. Ул 3 -2 -1- (-1, 0) У, 2 2 х -2 (-1, –1)
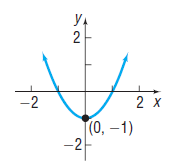
In problem, match each graph to one the following functions.f(x) = -x2 €“ 1A.B.C.D.E.F.G.H. Ул 3 -2 -1- (-1, 0) У, 2 2 х -2 (-1, –1)
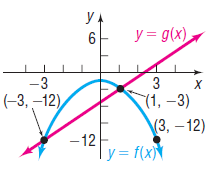
In problem, use the figure to solve each inequality.(a) f(x) < g(x)(b) f(x) ‰¥ g(x) y y = g(x) 6 -3 3 (-3, –12), (1, -3) ү3, — 12) -12 y = f(x)\
In problem, determine whether the function is linear or nonlinear. If the function is linear, state its slope.x …………………………… y = g(x)-1 …………………..………… -30 ……………………….……… 41 ………………………….…… 72
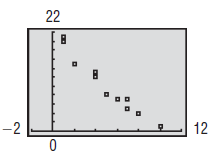
In problem, examine the scatter diagram and determine whether the type of relation is linear or nonlinear. 22 -2 12
In problem, determine whether the function is linear or nonlinear. If the function is linear, state its slope.x …………………………… y = f(x)-1 …………………..………… -20 ……………………….……… 31 ………………………….…… 82
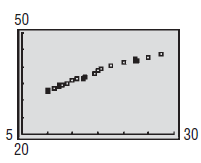
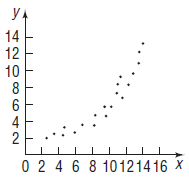
In problem, examine the scatter diagram and determine whether the type of relation is linear or nonlinear. Ул 14 12 10 8 0 2 4 6 8 10121416 x CO642N
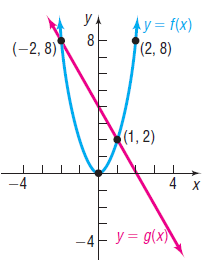
In problem, use the figure to solve each inequality.(a) g(x) ‰¥ f(x)(b) f(x) > g(x) y. y= f(x) (2, 8) 8 (-2, 8) (1, 2) -4 4 х -4- y= g(x)
In problem:(a) Determine the slope and y-intercept of each linear function.(b) Find the average rate of change of each function.(c) Graph each function. Label the intercepts.(d) Determine whether the function is increasing, decreasing, or constant.H(x) = -3
In problem:(a) Determine the slope and y-intercept of each linear function.(b) Find the average rate of change of each function.(c) Graph each function. Label the intercepts.(d) Determine whether the function is increasing, decreasing, or constant.G(x) = 4
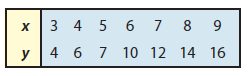
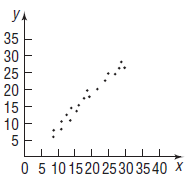
In problem, examine the scatter diagram and determine whether the type of relation is linear or nonlinear. Уд 35 30 25 20 15 10 0 5 10 1520 2530 3540 X
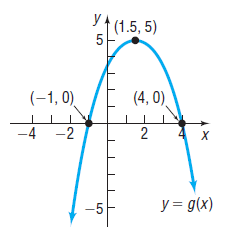
In problem, use the figure to solve each inequality.(a) g(x) < 0(b) g(x) ‰¥ 0 yA (1.5, 5) 5 (-1, 0) (4, 0) -4 -2 y = g(x)
In problem, match each graph to one the following functions.f(x) = x2 €“ 1A.B.C.D.E.F.G.H. Ул 3 -2 -1- (-1, 0) У, 2 2 х -2 (-1, –1)
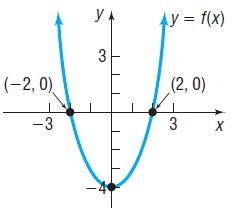
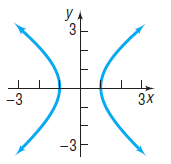
In problem, use the figure to solve each inequality.(a) f(x) > 0(b) f(x) ≤ 0 y A y = f(x) 3 (-2, 0) (2,0) -3 3
True or FalseThe correlation coefficient is a measure of the strength of a linear relation between two variables and must lie between -1 and 1, inclusive.
In problem:(a) Determine the slope and y-intercept of each linear function.(b) Find the average rate of change of each function.(c) Graph each function. Label the intercepts.(d) Determine whether the function is increasing, decreasing, or constant.F(x) = -1/3x + 1
A _____________ is used to help us to see the type of relation, if any, that may exist between two variables.
In problem:(a) Determine the slope and y-intercept of each linear function.(b) Find the average rate of change of each function.(c) Graph each function. Label the intercepts.(d) Determine whether the function is increasing, decreasing, or constant.h(x) = 4/5x - 6
Are the functions f(x) = x – 1 and g(x) = x2 – 1/x + 1the same? Explain.
In problem:(a) Determine the slope and y-intercept of each linear function.(b) Find the average rate of change of each function.(c) Graph each function. Label the intercepts.(d) Determine whether the function is increasing, decreasing, or constant.g(x) = -4x + 7
Find an equation of the line containing the points (1, 4) and (3, 8).
Write the interval (-2, 7] using inequality notation.
True or FalseIf the discriminant b2 – 4ac = 0, the graph of f(x) = ax2 + bx + c, a ≠ 0, will touch the x-axis at its vertex.
True or FalseThe y-coordinate of the vertex of f(x) = -x2 + 4x + 5 is f(2).
True or FalseThe graph of f(x) = 2x2 + 3x – 4 opens up.
The x-coordinate of the vertex of f(x) = ax2 + bx + c, a ≠ 0, is ____.
The vertical line passing through the vertex of a parabola is called the _________.
The graph of a quadratic function is called a(n) __________.
To graph y = (x - 4)2, you shift the graph of y = x2 to the a distance of units.
To complete the square of x2 – 5x, you add the number _______.
Find the real solutions of the equation 2x2 + 7x – 4 = 0.
Solve the inequality -3x - 2 < 7.
Plot the points (1, 5), (2, 6), (3, 9), (1, 12) in the Cartesian plane. Is the relation {(1, 5), (2, 6), (3, 9), (1, 12)}1 a function? Why?
In problem:(a) Determine the slope and y-intercept of each linear function.(b) Find the average rate of change of each function.(c) Graph each function. Label the intercepts.(d) Determine whether the function is increasing, decreasing, or constant.f(x) = 2x – 5
List the intercepts of the equation y = x2 – 9.
Some functions f have the property that f(a + b) = f(a) + f(b) for all real numbers a and b. Which of the following functions have this property?(a) h(x) = 2x(b) g(x) = x2(c) F(x) = 5x – 2(d) G(x) = 1/x
In problem, write the function whose graph is the graph of y = x3, but is:Horizontally stretched by a factor of 4
A wire of length x is bent into the shape of a circle.(a) Express the circumference C of the circle as a function of x.(b) Express the area A of the circle as a function of x.
In problem, match each graph to one of the following functions:A. y = x2 + 2B. y = -x2 + 2C. y = |x| + 2D. y = -|x| + 2E. y = (x - 2) 2F. y = -(x + 2) 2G. y = |x - 2|H. y = -|x + 2|I. y = 2x2J. y = -2x2K. y = 2|x|L. y = -2|x| y. 3 -3 3х -3F
In problem, write the standard form of the equation and the general form of the equation of each circle of radius r and center (h, k). Graph each circle.r = 2; (h, k) = (0, 0)
In problem, write the standard form of the equation and the general form of the equation of each circle of radius r and center (h, k). Graph each circle.r = 2; (h, k) = (0, 2)
In problem, determine which of the given points are on the graph of the equation.Equation: y3 = x + 1Points: (1, 2); (0, 1); (-1, 0)
In problem, write the standard form of the equation and the general form of the equation of each circle of radius r and center (h, k). Graph each circle.r = 3; (h, k) = (1, 0)
In problem, write the standard form of the equation and the general form of the equation of each circle of radius r and center (h, k). Graph each circle.r = 5; (h, k) = (4, -3)
In problem, determine which of the given points are on the graph of the equation.Equation: x2 + 4y2 = 6Points: (0, 1); (2, 0); (2, 1/2)
In problem, write the standard form of the equation and the general form of the equation of each circle of radius r and center (h, k). Graph each circle.r = 4; (h, k) = (2, -3)
In problem, list the intercepts and test for symmetry with respect to the x-axis, the y-axis, and the origin.x2 + 4x + y2 - 2y = 0
Plot the points (0, -3), (1, 3), -(2, 3), (5, 3) and (-4, 3). Describe the set of all points of the form (x, 3) where x is a real number.
In problem, find the intercepts and graph each equation by plotting points. Be sure to label the intercepts.y = x + 2
In problem, write the standard form of the equation and the general form of the equation of each circle of radius r and center (h, k). Graph each circle.r = 4; (h, k) = (-2, 1)
In problem, find the intercepts and graph each equation by plotting points. Be sure to label the intercepts.y = x - 6
In problem, write the standard form of the equation and the general form of the equation of each circle of radius r and center (h, k). Graph each circle.r = 7; (h, k) = (-5, -2)
In problem, find the intercepts and graph each equation by plotting points. Be sure to label the intercepts.y = 2x + 8
In problem, find an equation of the line having the given characteristics. Express your answer using either the general form or the slope–intercept form of the equation of a line, whichever you prefer.Slope = -2; containing the point (3, -1)
In problem, plot each point and form the triangle ABC. Verify that the triangle is a right triangle. Find its area.A = (-5, 3); B = (6, 0); C = (5, 5)
In problem, find the center and radius of each circle. Graph each circle. Find the intercepts, if any, of each circle.x2 + y2 - 2x + 4y - 4 = 0
In problem, use P1 = (-1, 3) and P2 = (5, -1).Find the distance from P1 to P2.
In problem, find the slope and y-intercept of each line. Graph the line.y - x = 0
Describe each of the following graphs in the xy-plane. Give justification.(a) x = 0(b) y = 0(c) x + y = 0(d) xy = 0(e) x2 + y2 = 0
In problem,(a) Find the center (h, k) and radius r of each circle;(b) Graph each circle;(c) Find the intercepts, if any.2x2 + 2y2 + 8x + 7 = 0
In problem, plot each point and form the triangle ABC. Verify that the triangle is a right triangle. Find its area.A = (4, -3); B = (0, -3); C = (4, 2)
In problem, the graph of an equation is given.(a) Find the intercepts.(b) Indicate whether the graph is symmetric with respect to the x-axis, the y-axis, or the origin. y. Ж УА 3 -3 3x -3-
In problem, find the standard form of the equation of each circle.Center (4, -2) and tangent to the line x = 1(a) (x – 3)2 + (y + 3) 2 = 9(b) (x + 1) 2 + (y - 2) 2 = 4(c) (x - 1) 2 + (y + 2) 2 = 4(d) (x + 3) 2 + (y - 3) 2 = 9
The endpoints of the diameter of a circle are (-3, 2) and (5, -6). Find the center and radius of the circle. Write the standard equation of this circle.
In problem, find the slope and y-intercept of each line. Graph the line.1/2 y = x - 1
In problem, the equations of two lines are given. Determine if the lines are parallel, perpendicular, or neither.y = 2x – 3y = 2x + 4
In problem, the equations of two lines are given. Determine if the lines are parallel, perpendicular, or neither.y = 4x + 5y = -4x + 2
Which of the following equations might have the graph shown? (More than one answer is possible.)(a) 2x + 3y = 6(b) -2x + 3y = 6(c) 3x - 4y = -12(d) x – y = 1(e) x – y = -1(f) y = 3x - 5(g) y = 2x + 3(h) y = -3x + 3
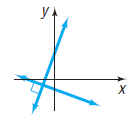
The figure shows the graph of two perpendicular lines. Which of the following pairs of equations might have such a graph?(a) y - 2x = 2y + 2x = -1(b) y - 2x = 02y + x = 0(c) 2y €“ x = 22y + x = -2(d) y - 2x = 2x + 2y = -1(e) 2x + y = -22x + y = -22y + x = -2 y.
If the point (5, -3) is a point on the graph of f, then f(_____) = ______.
Find a so that the point (-1, 2) is on the graph of f(x) = ax2 + 4.
Use a graphing utility to graph the function f(x) = -x4 + 2x3 + 4x2 - 2 on the interval (-5, 5).Approximate any local maximum values and local minimum values rounded to two decimal places. Determine where the function is increasing and where it is decreasing.
A(n) function f is one for which f(-x) = f(x) for every x in the domain of f; a(n) function f is one for which f(-x) = -f(x) for every x in the domain of f.
If the domain of f is all real numbers in the interval [0, 7] and the domain of g is all real numbers in the interval [-2, 5], the domain of f + g is all real numbers in the interval _______.
Showing 28500 - 28600
of 29454
First
279
280
281
282
283
284
285
286
287
288
289
290
291
292
293
Last
Step by Step Answers