New Semester
Started
Get
50% OFF
Study Help!
--h --m --s
Claim Now
Question Answers
Textbooks
Find textbooks, questions and answers
Oops, something went wrong!
Change your search query and then try again
S
Books
FREE
Study Help
Expert Questions
Accounting
General Management
Mathematics
Finance
Organizational Behaviour
Law
Physics
Operating System
Management Leadership
Sociology
Programming
Marketing
Database
Computer Network
Economics
Textbooks Solutions
Accounting
Managerial Accounting
Management Leadership
Cost Accounting
Statistics
Business Law
Corporate Finance
Finance
Economics
Auditing
Tutors
Online Tutors
Find a Tutor
Hire a Tutor
Become a Tutor
AI Tutor
AI Study Planner
NEW
Sell Books
Search
Search
Sign In
Register
study help
mathematics
precalculus
Calculus Early Transcendentals 8th edition James Stewart - Solutions
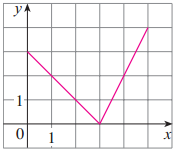
Find an expression for the function whose graph is the given curve. 1 х
Solve each inequality for x.(a) 1 < e3x–1 < 2(b) 1 – 2 ln x < 3
A spherical balloon is being inflated and the radius of the balloon is increasing at a rate of 2 cm/s.(a) Express the radius r of the balloon as a function of the time it (in seconds).(b) If V is the volume of the balloon as a function of the radius, find V ∘ r and interpret it.
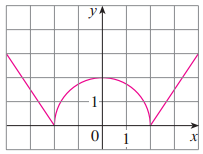
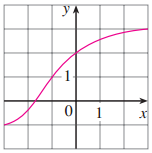
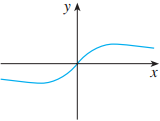
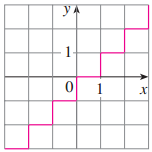
Find an expression for the function whose graph is the given curve. A y 1
(a) What are the values of eln 300 and ln(e300)?(b) Use your calculator to evaluate eln 300 and ln(e300).What do you notice? Can you explain why the calculator has trouble?
Find a formula for the described function and state its domain. A rectangle has area 16 m2. Express the perimeter of the rectangle as a function of the length of one of its sides.
Find a formula for the described function and state its domain. Express the area of an equilateral triangle as a function of the length of a side.
Find a formula for the described function and state its domain. A closed rectangular box with volume 8 ft3 has length twice the width. Express the height of the box as a function of the width.
Find a formula for the described function and state its domain. An open rectangular box with volume 2 m3 has a square base. Express the surface area of the box as a function of the length of a side of the base.
If you invest x dollars at 4% interest compounded annually, then the amount A(x) of the investment after one year is A(x) = 1.04x. Find A ∘ A, A ∘ A ∘ A, and A ∘ A ∘ A ∘ A. What do these compositions represent? Find a formula for the composition of n copies of A.
Find the exact value of each expression.(a) cos–1( – 1)(b) sin–1(0.5)
A cell phone plan has a basic charge of $35 a month. The plan includes 400 free minutes and charges 10 cents for each additional minute of usage. Write the monthly cost C as a function of the number x of minutes used and graph C as a function of x for 0 ≼ x ≼ 600.
Find the exact value of each expression.(a) csc–1√2(b) arcsin 1
Suppose g is an odd function and let h = f ∘ g. Is h always an odd function? What if f is odd? What if f is even?
Find the exact value of each expression.(a) sin–1(–1/√2)(b) cos–1(√3/2)
An electricity company charges its customers a base rate of $10 a month, plus 6 cents per kilowatt-hour (kWh) for the first 1200 kWh and 7 cents per kWh for all usage over 1200 kWh. Express the monthly cost E as a function of the amount x of electricity used. Then graph the
Find the exact value of each expression.(a) cot–1(–√3)(b) sec–12
Find the exact value of each expression.(a) arcsin(sin(5π/4))(b) cos(2 sin–1(5/13))
Determine whether the statement is true or false. If it is true, explain why. If it is false, explain why or give an example that disproves the statement.If x1 < x2 and f is a decreasing function, then f(x1) > f(x2)
Simplify the expression.sin(2 arccos x)
Graph the given functions on the same screen. How are these graphs related?y = tan x, –π/2 < x < π/2; y = tan –1 x; y = x
Determine whether f is even, odd, or neither. If you have a graphing calculator, use it to check your answer visually. x? |f(x) x* + 1
Determine whether f is even, odd, or neither. If you have a graphing calculator, use it to check your answer visually. |f(x) = x + 1 х
Determine whether f is even, odd, or neither. If you have a graphing calculator, use it to check your answer visually.f(x) = x|x|
Determine whether f is even, odd, or neither. If you have a graphing calculator, use it to check your answer visually.f(x) = 1 + 3x2 – x4
Determine whether f is even, odd, or neither. If you have a graphing calculator, use it to check your answer visually.f(x) = 1 + 3x3 – x5
If f and g are both even functions, is f + g even? If f and g are both odd functions, is f + g odd? What if f is even and g is odd? Justify your answers.
If f and g are both even functions, is the product fg even? If f and g are both odd functions, is fg odd? What if f is even and g is odd? Justify your answers.
Graph the function by hand, not by plotting points, but by starting with the graph of one of the standard functions given in Section 1.2, and then applying the appropriate transformations.y = |√x – 1|
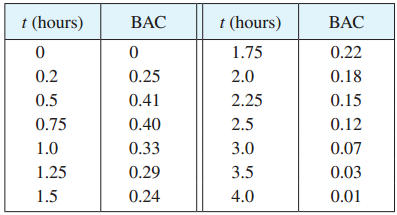
Researchers measured the blood alcohol concentration (BAC) of eight adult male subjects after rapid consumption of 30 mL of ethanol (corresponding to two standard alcoholic drinks). The table shows the data they obtained by averaging the BAC (in mgymL) of the eight men.(a)
Graph the function by hand, not by plotting points, but by starting with the graph of one of the standard functions given in Section 1.2, and then applying the appropriate transformations.y = |cos πx|
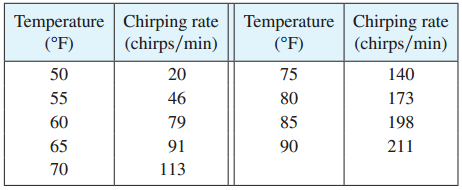
Biologists have observed that the chirping rate of crickets of a certain species appears to be related to temperature. The table shows the chirping rates for various temperatures.(a) Make a scatter plot of the data.(b) Find and graph the regression line.(c) Use the linear model in part
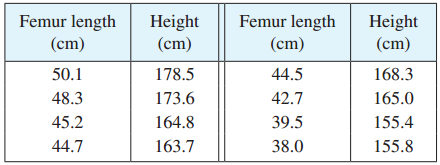
Anthropologists use a linear model that relates human femur (thighbone) length to height/The model allows an anthropologist to determine the height of an individual when only a partial skeleton (including the femur) is found. Here we find the model by analyzing the data on femur length
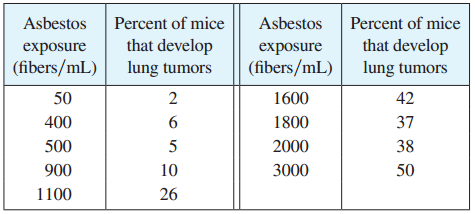
When laboratory rats are exposed to asbestos fibers, some of them develop lung tumors. The table lists the results of several experiments by different scientists.(a) Find the regression line for the data.(b) Make a scatter plot and graph the regression line. Does the regression line
Some of the highest tides in the world occur in the Bay of Fundy on the Atlantic Coast of Canada. At Hopewell Cape the water depth at low tide is about 2.0 m and at high tide it is about 12.0 m. The natural period of oscillation is about 12 hours and on June 30, 2009, high
Find an explicit formula for f–1 and use it to graph f–1, f, and the line y = x on the same screen. To check your work, see whether the graphs of f and f–1 are reflections about the line.f(x) = √4x + 3
The table shows world average daily oil consumption from 1985 to 2010 measured in thousands of barrels per day.(a) Make a scatter plot and decide whether a linear model is appropriate.(b) Find and graph the regression line.(c) Use the linear model to estimate the oil consumption in 2002 and
Evaluate the difference quotient for the given function. Simplify your answer. f(a + h) – f(a) f(x) = r, h
In a normal respiratory cycle the volume of air that moves into and out of the lungs is about 500 mL. The reserve and residue volumes of air that remain in the lungs occupy about 2000 mL and a single respiratory cycle for an average human takes about 4 seconds. Find a model
The table shows average US retail residential prices of electricity from 2000 to 2012, measured in cents per kilowatt hour.(a) Make a scatter plot. Is a linear model appropriate?(b) Find and graph the regression line.(c) Use your linear model from part (b) to estimate the average retail
Evaluate the difference quotient for the given function. Simplify your answer. f(x) – f(a) f(x) X - a
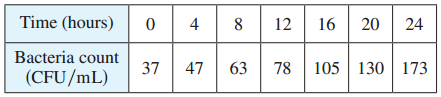
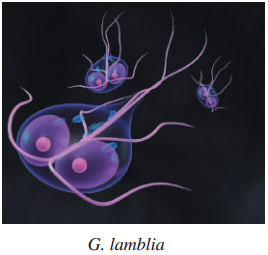
A researcher is trying to determine the doubling time for a population of the bacterium Giardia lamblia. He starts a culture in a nutrient solution and estimates the bacteria count every four hours. His data are shown in the table.(a) Make a scatter plot of the data.(b) Use a graphing calculator to
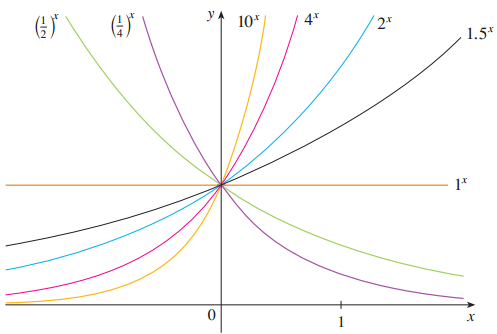
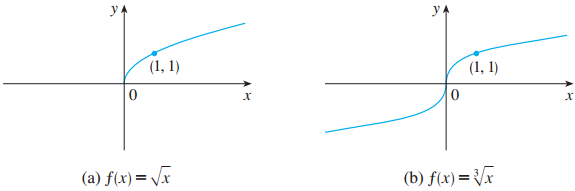
Make a rough sketch of the graph of the function. Do not use a calculator. Just use the graphs given in Figures 3 and 13 and, if necessary, the transformations of Section 1.3.y = 1 €“ 1/2 „¯€“xFigure 3:Figure 13: yA 10* (45 4* 2* 1.5* х y. (1,
Graph the function by hand, not by plotting points, but by starting with the graph of one of the standard functions given in Section 1.2, and then applying the appropriate transformations.y = |x – 2|
Find the domain of each function.(a)(b) g(t) = sin(„¯t €“ 1) g(t) = /10' – 100
Graph the function by hand, not by plotting points, but by starting with the graph of one of the standard functions given in Section 1.2, and then applying the appropriate transformations.y = |x| – 2
Graph the function by hand, not by plotting points, but by starting with the graph of one of the standard functions given in Section 1.2, and then applying the appropriate transformations.y = sin (1/2 x)
Starting with the graph of y = ℯx, find the equation of the graph that results from(a) Reflecting about the line y = 4.(b) Reflecting about the line x = 2.
The graph of f is given.(a) Why is f one-to-one?(b) What are the domain and range of f€“1?(c) What is the value of f€“1 (2)?(d) Estimate the value of f-1(0). 1
Graph the function by hand, not by plotting points, but by starting with the graph of one of the standard functions given in Section 1.2, and then applying the appropriate transformations.y = 2 – √x
Is it true that f ∘ (g + h) = f ∘ g + f ∘ h?
Graph the function by hand, not by plotting points, but by starting with the graph of one of the standard functions given in Section 1.2, and then applying the appropriate transformations.y = 1 + sin πx
Make a rough sketch of the graph of the function. Do not use a calculator. Just use the graphs given in Figures 3 and 13 and, if necessary, the transformations of Section 1.3.y = 2(1 €“ „¯x)Figure 3:Figure 13: yA 10* (45 4* 2* 1.5* х y. (1, 1) (1, 1) х х (a)
If f(x) = x5 + x3 + x, find f–1(3) and f(f–1(2))
Jason leaves Detroit at 2:00 PM and drives at a constant speed west along 1-94. He passes Ann Arbor, 40 mi from Detroit, at 2:50 PM.(a) Express the distance traveled in terms of the time elapsed.(b) Draw the graph of the equation in part (a).(c) What is the slope of this line? What does
Graph the function by hand, not by plotting points, but by starting with the graph of one of the standard functions given in Section 1.2, and then applying the appropriate transformations.y = x2 – 4x + 5
Use transformations to sketch the graph of the function.f(x) = – cos 2x
Determine whether the statement is true or false. If it is true, explain why. If it is false, explain why or give an example that disproves the statement.If x is any real number, then √x2 = x.
Graph the function by hand, not by plotting points, but by starting with the graph of one of the standard functions given in Section 1.2, and then applying the appropriate transformations.y = 2 √x + 1
Make a rough sketch of the graph of the function. Do not use a calculator. Just use the graphs given in Figures 3 and 13 and, if necessary, the transformations of Section 1.3.v = e|x|Figure 3:Figure 13: yA 10* (45 4* 2* 1.5* х y. (1, 1) (1, 1) х х (a) f(x)= x %3D (b) f(x)= {x
Sketch a rough graph of the market value of a new car as a function of time for a period of 20 years. Assume the car is well maintained.
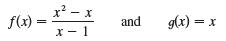
Ifis it true that f = g? x - x f(x) and g(x) = x X - 1
Determine whether the statement is true or false. If it is true, explain why. If it is false, explain why or give an example that disproves the statement.If f is a function, then f(3x) = 3f(x).
Use the Law of Exponents to rewrite and simplify the expression. (a) x2n · x3n–1/xn+2(b) √a√b/3√ab
Sketch a rough graph of the yield of a crop as a function of the amount of fertilizer used.
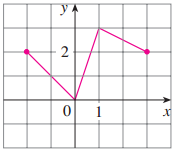
The graph off is given. Draw the graphs of the following functions.(a) y = f(x) €“ 3(b) y = f(x + 1)(c) y = 1/2 f(x)(d) y = €“f(x) ут х 2.
Solve the inequality |x – 1| – |x – 3| ≥ 5.
(a) Write an equation that defines the exponential function with base b > 0.(b) What is the domain of this function?(c) If b ≠ 1, what is the range of this function?(d) Sketch the general shape of the graph of the exponential function for each of the following cases.(i) b > 1(ii)
Determine whether the statement is true or false. If it is true, explain why. If it is false, explain why or give an example that disproves the statement.A vertical line intersects the graph of a function at most once.
Find the domain and range of the function. Write your answer in interval notation.g(x) = √16 – x4
Sketch the graph of the function g(x) = |x2 – 1 | – |x2 – 4|.
Determine whether the statement is true or false. If it is true, explain why. If it is false, explain why or give an example that disproves the statement.If f is one-to-one, then f–1(x) = 1/f(x).
Find the domain and range of the function. Write your answer in interval notation.f(t) = 3 + cos 2t
A function is given by a table of values, a graph, a formula, or a verbal description. Determine whether it is one-to-one. х
Determine whether the statement is true or false. If it is true, explain why. If it is false, explain why or give an example that disproves the statement.You can always divide by ex.
A function is given by a table of values, a graph, a formula, or a verbal description. Determine whether it is one-to-one.f(x) = 2x – 3
Determine whether the statement is true or false. If it is true, explain why. If it is false, explain why or give an example that disproves the statement.If 0 < a < b, then ln a < ln b.
Graph the function by hand, not by plotting points, but by starting with the graph of one of the standard functions given in Section 1.2, and then applying the appropriate transformations.y = – x2
Determine whether the curve is the graph of a function of x. If it is, state the domain and range of the function. ул 1. х
Determine whether the statement is true or false. If it is true, explain why. If it is false, explain why or give an example that disproves the statement.If x > 0, then (ln x)6 = 6 ln x.
A function is given by a table of values, a graph, a formula, or a verbal description. Determine whether it is one-to-one.f(x) = x4 – 16
Graph the function by hand, not by plotting points, but by starting with the graph of one of the standard functions given in Section 1.2, and then applying the appropriate transformations.y = (x – 3)2
Sketch the region in the plane defined by each of the following equations or inequalities.(a) max{x, 2y} = 1(b) –1 ≤ max {x, 2y} ≤ 1(c) max{x, y2} = 1
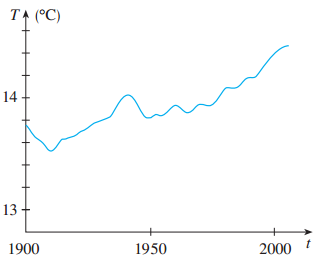
Shown is a graph of the global average temperature T during the 20th century. Estimate the following.(a) The global average temperature in 1950(b) The year when the average temperature was 14.2°C(c) The year when the temperature was smallest? Largest?(d) The range of
Use transformations to sketch the graph of the function.y = (x – 2)3
Make a rough sketch of the graph of the function. Do not use a calculator. Just use the graphs given in Figures 3 and 13 and, if necessary, the transformations of Section 1.3.y = 4x €“ 1Figure 3:Figure 13: yA 10* (45 4* 2* 1.5* х y. (1, 1) (1, 1) х х (a) f(x)= x %3D (b)
A function is given by a table of values, a graph, a formula, or a verbal description. Determine whether it is one-to-one.g(x) = 1 – sin x
Determine whether the statement is true or false. If it is true, explain why. If it is false, explain why or give an example that disproves the statement.If x > 0 and a > 1, then ln x/ln a = ln x/a.
Graph the function by hand, not by plotting points, but by starting with the graph of one of the standard functions given in Section 1.2, and then applying the appropriate transformations.y = x3 + 1
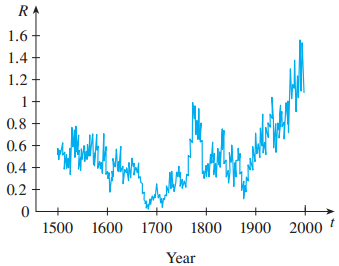
Trees grow faster and form wider rings in warm years and grow more slowly and form narrower rings in cooler years. The figure shows ring widths of a Siberian pine from 1500 to 2000.(a) What is the range of the ring width function?(b) What does the graph tend to say about the
Use transformations to sketch the graph of the function.y = 2√x
Recent studies indicate that the average surface temperature of the earth has been rising steadily. Some scientists have modeled the temperature by the linear function T = 0.02t + 8.50, where T is 'temperature in °C and t represents years since 1900.(a) What do the slope and T-intercept
Make a rough sketch of the graph of the function. Do not use a calculator. Just use the graphs given in Figures 3 and 13 and, if necessary, the transformations of Section 1.3.y = (0.5)x€“1Figure 3:Figure 13: yA 10* (45 4* 2* 1.5* х y. (1, 1) (1, 1) х х (a) f(x)= x %3D (b)
A function is given by a table of values, a graph, a formula, or a verbal description. Determine whether it is one-to-one.g(x) = 3√x
Graph the function by hand, not by plotting points, but by starting with the graph of one of the standard functions given in Section 1.2, and then applying the appropriate transformations.y = 1 – 1/x
Determine whether the statement is true or false. If it is true, explain why. If it is false, explain why or give an example that disproves the statement.tan–1(–1) = 3π/4
(a) Show that the functionis an odd function.(b) Find the inverse function of f. f(x) = In(x + x² + 1 Vx? +
Use transformations to sketch the graph of the function.y = x2 – 2x + 2
A function is given by a table of values, a graph, a formula, or a verbal description. Determine whether it is one-to-one. f(t) is the height of a football t seconds after kickoff.
Make a rough sketch of the graph of the function. Do not use a calculator. Just use the graphs given in Figures 3 and 13 and, if necessary, the transformations of Section 1.3.y = €“2€“xFigure 3:Figure 13: yA 10* (45 4* 2* 1.5* х y. (1, 1) (1, 1) х х (a) f(x)= x
Showing 28200 - 28300
of 29454
First
276
277
278
279
280
281
282
283
284
285
286
287
288
289
290
Last
Step by Step Answers