New Semester
Started
Get
50% OFF
Study Help!
--h --m --s
Claim Now
Question Answers
Textbooks
Find textbooks, questions and answers
Oops, something went wrong!
Change your search query and then try again
S
Books
FREE
Study Help
Expert Questions
Accounting
General Management
Mathematics
Finance
Organizational Behaviour
Law
Physics
Operating System
Management Leadership
Sociology
Programming
Marketing
Database
Computer Network
Economics
Textbooks Solutions
Accounting
Managerial Accounting
Management Leadership
Cost Accounting
Statistics
Business Law
Corporate Finance
Finance
Economics
Auditing
Tutors
Online Tutors
Find a Tutor
Hire a Tutor
Become a Tutor
AI Tutor
AI Study Planner
NEW
Sell Books
Search
Search
Sign In
Register
study help
mathematics
statistics behavioral sciences
Introductory Statistics For The Behavioral Sciences 7th Edition Joan Welkowitz, Barry H. Cohen, R. Brooke Lea - Solutions
Give an example of when each of the procedures discussed in this chapter should be used:(a) Rank-sum test;(b) Wilcoxon test.
Separately for each of the five majors in Ihno's data set, use the rank sum test to determine whether male students differ significantly from female students with respect to(a) Statistics quiz scores,(b) Prequiz anxiety scores,(c) Math phobia ratings.
Parametric statistical tests are based on certain assumptions about unobservable population distributions. If these assumptions are incorrect, the parametric tests are likely to yield misleading results (and should therefore not be used). Yet we never know for certain what the population
Repeat Exercise 5 for the anxiety measurements.Data from exercise 5Perform a matched-pairs t test to determine whether there is a significant increase in heart rate from baseline to the prequiz measurement. Also, test the difference between the pre- and postquiz measurements. (Advanced exercise:
(a) What is the difference between the t test for two independent sample means and the matched-pairs t test?(b) What is the difference between the matched-pairs design and the repeated-measures design? What are their relative advantages and disadvantages?
Students at Rolling Rock University claim that their school is superior to vaunted Bigbrain University with regard to achievement on a national aptitude test, where the mean is 500 and the standard deviation is 100. A random sample of students is obtained from each university, the mean for the
Repeat Exercise 3 for the postquiz anxiety scores.Data from exercise 3Perform a two-sample t test to determine whether the students in the “impossible to solve” condition exhibited significantly higher postquiz heart rates than the students in the “easy to solve” condition at the .05 level.
Suppose that the difference between two sample means is not statistically significant.(a) What decision should the researcher make about the null hypothesis?(b) Assuming that all of the procedures and calculations in this experiment were done correctly, why might this decision still be
Perform a two-sample t test to determine whether the students in the “impossible to solve” condition exhibited significantly higher postquiz heart rates than the students in the “easy to solve” condition at the .05 level. Is this t test significant at the .01 level? Find the 99% CI for the
Suppose that the difference between two sample means is statistically significant.(a) What decision should the researcher make about the null hypothesis?(b) Assuming that all of the procedures and calculations in this experiment were done correctly, why might this decision still be incorrect?(c) If
Repeat Exercise 1 for baseline heart rate.Data from exercise 1Use your statistical package to perform a two-sample t test to determine whether there is a statistically significant difference in baseline anxiety between the men and the women of Ihno's class. Find the 95% CI for this gender
A behavioral science researcher wishes to test a null hypothesis about the difference between the means of two populations.(a) Would the researcher prefer that the standard error of the difference be relatively small or large? Why?(b) If the size of one or both samples becomes larger, what happens
Use your statistical package to perform a two-sample t test to determine whether there is a statistically significant difference in baseline anxiety between the men and the women of Ihno's class. Find the 95% CI for this gender difference. Report your results as they might appear in a journal
(a) What is the difference between random sampling and random assignment?(b) What similar purpose do these two procedures have?(c) Which one is usually much easier to do? Why?
A behavioral science researcher wishes to draw inferences about the proportion of one population.(a) Would she prefer that the standard error of a proportion be small or large? Why?(b) Should she use the normal curve model or the t distributions as her theoretical model? Why?](c) When should she
On a test of scholastic ability administered to college students in the United States, the mean is 500 and the standard deviation is 100. Each of the following 95% CIs for the mean of one population was computed from a random sample of students from the university in question: University Y,
(a) Why does the size of the CI become larger when we change from a 95% CI to a 99% CI?(b) We can be more certain that the unknown population mean falls within the 99% CI than within the 95% CI. Why, then, don't we always use 99% CIs?
Use your statistical package to perform a one-sample t test to determine whether the average postquiz heart rate of Ihno's female students differs significantly (α = .05) from the mean resting HR (μ = 72) for college-aged women. Find the 95% CI for the population mean represented by Ihno's female
(a) What happens to the size of a CI as the standard error of the mean becomes larger? Why?(b) What happens to the size of a CI as the sample size becomes larger? Why?(c) What are the advantages of having a smaller CI?
Use your statistical package to perform a one-sample t test to determine whether the average baseline heart rate of Ihno's male students differs significantly from the mean HR (μ = 70) for college-aged men at the .01 level. Find the 99% CI for the population mean represented by Ihno's male
What advantages do confidence intervals have over testing a specific null hypothesis?
Use your statistical package to perform a one-sample t test to determine whether the baseline anxiety of Ihno's students differs significantly (α = .05) from the mean (μ = 18) found by a very large study of college students across the country. Find the 95% confidence interval for the population
You are drawing inferences about the mean of one population.(a) When should you use the t distributions as the theoretical model rather than the normal curve model?(b) Why is there a different critical t value for different degrees of freedom?
(a) What is the difference between a one-tailed test of significance and a two-tailed test of significance?(b) What are the disadvantages of using one-tailed tests of significance? Of using two-tailed tests of significance?
The probability of making a Type I error when using the .01 criterion of significance is lower than when using the .05 criterion of significance. Why, then, don't researchers always use the .01 criterion, instead of the .05 criterion?
You are using the .05 criterion of significance.(a) If the two-tailed p value (i.e., the probability of obtaining the results you got if H0 is true and the hypothesized value of the population mean is correct) is .03, what decision should you make about H0? Why?(b) If the two-tailed p value is .33,
(a) What is the difference between the standard deviation of a set of scores and the standard error of the mean?(b) Do behavioral science researchers want the standard error of the mean to be small or large? Why?(c) What happens to the standard error of the mean as the sample size (N) becomes
Which of the following are random samples from the specified populations and which are not? Why?(a) An experimenter selects every 10th name in the telephone book for her city, starting with one name that is chosen blindly. Population: all those with listed telephone numbers in her city.(b) Teenage
Repeat Exercise 3 for the women in Ihno's statistics class.Data from exercise 3Given that for SAT scores, μ = 500 and σ = 100:
(a) What is a random sample?(b) Why are random samples desirable in behavioral science research?(c) Why is it often difficult or impossible to obtain a sample that is truly random?
Assuming that the mean resting heart rate for all college-aged men (μ) is 70 bpm, with σ = 6, what is the z score for the baseline HR of the men in Ihno's data set? What are the one- and two-tailed p values that correspond to this z score?
(a) Do researchers in the behavioral sciences want to draw conclusions about populations or about samples? Why?(b) Why, then, must researchers use samples?(c) What problems are caused by having to use samples? Include and explain the term sampling error in your answer.
Assuming that a normative study has shown that the mean anxiety level for college students (μ) is 18 (σ = 11) on the scale that Ihno used, what is the z score for the baseline anxiety scores in Ihno's class? What are the one and two-tailed p values that correspond to this z score?
If you know that a distribution of scores is bimodal, or asymmetric, or a J-curve, or any other shape that departs significantly from the normal distribution, would it be correct to use Table A to solve problems, as was done in this chapter? Why or why not?
Suppose that in the previous question, the SD of each exam is changed to 3. How would this affect the likelihood that there are scores on the first exam that are greater than the mean of the second exam? Draw an appropriate figure to help you answer this question.
The distributions of scores on two exams are approximately normal. The mean of the first exam is 80, and the mean of the second exam is 95. The SD of each exam is 15. Draw a figure to show that there must be some scores on the first exam that are greater than the mean of the second exam.
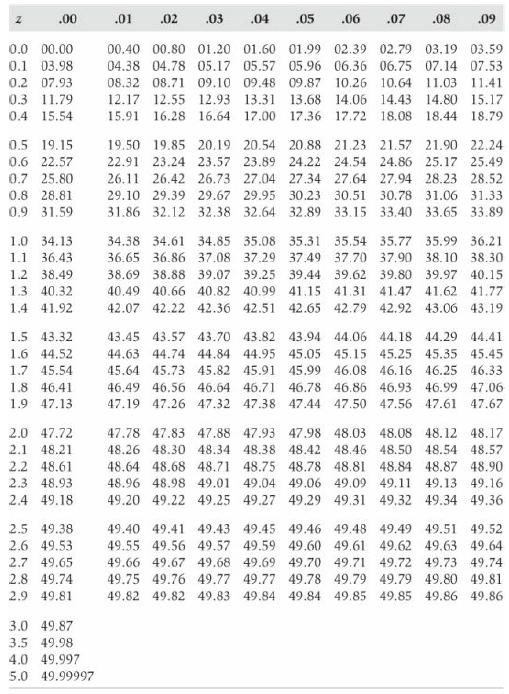
Why is Table A given in terms of z scores rather than raw scores? Table A .00 .01 .02 .03 .04 .05 .06 .07 .08 .09 0.0 00.00 00.40 00.80 01.20 01.60 01.99 02.39 02.79 03.19 03.59 0.1 03.98 04.38 04.78 05.17 05.57 05.96 06.36 06.75 07.14 07.53 0.2 07.93 08.32 08.71 09.10 09.48 09.87 10.26 10.64
Repeat Exercise 2 for the statistics quiz score that was part of Ihno's experiment.Data from exercise 2Use your statistical package to create a z-score variable corresponding to the math background quiz score, and then transform the z-score variable to a T score, an SAT score, and an IQ score.
For the same exams as in the previous question, another student scores 91 on the psychology exam and 93 on the English exam. He concludes that he did better on the English exam because his English score is 16 points above average, while his psychology score is only 10 points above average. Is he
Use your statistical package to create a z-score variable corresponding to the math background quiz score, and then transform the z-score variable to a T score, an SAT score, and an IQ score.
A college student takes two introductory courses for first-year students. On her psychology exam, she scores 73; the mean is 81.0, and the SD is 5.0. On her English exam, she scores 67; the mean is 77, and the SD is 10.0. Both distributions are approximately normal. She concludes that she did
Use your statistical package to create new variables consisting of the z scores for the anxiety and heart rate measures both at baseline and prequiz in Ihno's data set. Request means and standard deviations of the z-score variables to demonstrate that the means and SDs are 0 and 1, respectively, in
What are the advantages of having a set of scores that has a mean of zero and a standard deviation of 1 (z scores)?
(a) When is it desirable to use the SIQR as the measure of variability?(b) When is it desirable to use the mean deviation (MD) as the measure of variability?
If the standard deviation of a set of scores is zero, what does this imply about the scores? Can a standard deviation be negative? Why or why not?
(a) When computing the standard deviation of a set of scores, when do we divide by N, and when do we divide by N − 1?(b) What is the difference between σ and s?
Use your statistical package to create a new variable that adds 50 points to the math quiz score. How have the measures of variability changed for this new variable as compared to the same measures calculated for the original math quiz score? What general principle is being illustrated with respect
The mean of a statistics examination is 77.0.(a) If your score is 85, would you prefer the standard deviation to be large or small for purposes of getting a better grade? Why?(b) If your score is 69, would you prefer the standard deviation to be large or small? Why?
Use your statistical package to create a new variable that is equal to 2 times the diagnostic quiz score, so that the new variable is measured on a 0 to 100 scale. How do the measures of variability found in the previous exercise compare between the new variable and the original math quiz score?
Why is the range much less informative (and much less useful) as a measure of variability than the standard deviation? Give an example of when the range could really be useful.
Use your statistical package to find the range, semi-interquartile range, unbiased variance, and unbiased standard deviation for each of the quantitative variables in Ihno's data set. (Does your statistical package offer you the option of obtaining the biased versions of the variance and standard
Consider the following set of data, which represents 15 scores on a 10-point quiz: 0, 1, 3, 3, 4, 4, 4, 5, 5, 5, 7, 8, 9, 9, 10.(a) If the score of 10 is changed to 225,000,000, but the other numbers remain the same, what is the general effect on the mean and the median?(b) If the score of 10 is
(a) In a positively skewed distribution, which is larger, the mean or the median?(b) In a negatively skewed distribution, which is larger, the mean or the median?(c) In a symmetric distribution (such as the normal distribution), which is larger, the mean or the median?
Use your statistical package to find the mode, median, and mean for each of the quantitative variables in Ihno's data set.
For each of the following problems, which measure of central tendency should be computed?(a) An experimental psychologist wants a measure of central tendency for the number of trials taken to learn a task by 45 eight-year-old children. The maximum number of trials allowed is 30. Most of the
Rachel's percentile rank on a psychology test is 93. Darcy's percentile rank on a physics test is 80. Why is it potentially incorrect to conclude that Rachel did better than Darcy?
Repeat Exercise 8 separately for male and female students.Data from exercise 8Request the quartiles for the variables Baseline Anxiety and Prequiz Anxiety for all students. Describe the shift in anxiety scores between these two measurement points.
For each of the following, state which one represents better performance or if they are the same:(a) The 3rd quartile and the 70th percentile.(b) The 1st quartile and the 3rd decile.(c) The median and the 50th percentile.(d) The median and the 2nd quartile.(e) The 6th decile and the 80th percentile.
Request the quartiles for the variables Baseline Anxiety and Prequiz Anxiety for all students. Describe the shift in anxiety scores between these two measurement points.
What is the difference between a percentile rank and a percentile?
Request the deciles for the variable Quiz Score across all students.
Why might you want to convert a raw score into a percentile rank?
Request a stem-and-leaf plot for the variables Baseline Anxiety and Baseline Heart Rate for all students. Did your statistical package use the stem-and-leaf arrangement that you would have used for maximum clarity? Explain.
What is a bimodal distribution? If a distribution of grades in a college course is bimodal, what does this imply about the students who took the course?
Repeat Exercise 4 separately for male and female students. Describe the shapes of all four of the resulting distributions.Data from exercise 4Request a frequency distribution and a histogram for the variables Baseline Anxiety and Baseline Heart Rate for all students. Comment on your statistical
In a negatively skewed distribution, are the unusual scores extremely large or extremely small? At what end of the graph is the “tail”?
Request a frequency distribution and a histogram for the variables Baseline Anxiety and Baseline Heart Rate for all students. Comment on your statistical software's choice of class intervals for each histogram.
Request a frequency distribution and a histogram for the variable Quiz Score across all students. Describe the shape of this distribution.
In a positively skewed distribution, are the unusual scores extremely large or extremely small? At what end of the graph is the “tail”?
What is a symmetric distribution?
For which of the following should you use a bar chart, and for which should you use a histogram? Why?(a) Scores on a midterm examination in psychology taken by 50 students.(b) The number of children in each of the families of the 50 students taking the psychology course.
Request a frequency distribution and a bar chart for the variable Undergraduate Major across all 100 of Ihno's students.
What kind of measurement scales are used for each of the following variables in Ihno's study?(a) The gender of each student.(b) The undergraduate major of each student.(c) The number of math courses each student has already completed.(d) Score on math background quiz.
A poll of sportswriters ranks the 25 best college football teams in the country, where #1 is the best team, #2 is the second best team, and so on. What kind of measurement scale is this?
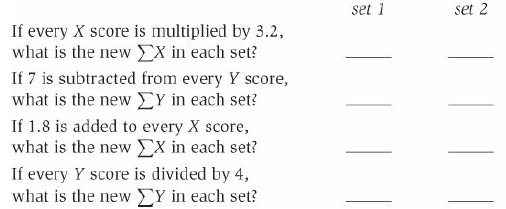
Create a new variable that is 10 times the statistics quiz score. How does the sum of this variable compare to the sum of the original variable? What general rule is being illustrated by this comparison?
We are classifying psychiatric patients as having one or another of five different psychological disorders— Major Depressive Disorder, Bipolar Disorder, Generalized Anxiety Disorder, Obsessive-Compulsive Disorder, and Phobic Disorder—what kind of measurement scale are we using?
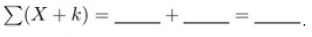
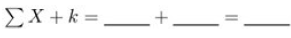
Create a new variable that adds 10 points to everyone's math background quiz score. How does the sum of this variable compare to the sum of the original variable? What general rule is being illustrated by this comparison?
What important property do interval scales have that ordinal and nominal scales do not have?
Label the values of the categorical (i.e., qualitative) variables according to the following codes: For gender, 1 = Female and 2 = Male; for undergrad major, 1 = Psychology, 2 = Pre-med, 3 = Biology, 4 = Sociology, and 5 = Economics. Your instructor may ask you to fill in missing-value codes for
Calculate the mean deviation for Doty Hall, and compare it to σ (as calculated in Exercise 7). What do you think would happen to the difference of these two measures if you were to add an extreme score to the data of Doty?
Express the following words in symbols.(a) Add up all the scores on test X, then add up all the scores on test Y, and then add the two sums together.(b) Add up all the scores on test G. To this, add the following: the sum obtained by squaring all the scores on test P and then adding them up.(c)
Compute the following (these values will not by themselves help Carrie to make a decision about the dormitories, but we will use these values as steps in future exercises to answer Carrie's concern):(a) For Turck Hall:(b) For Kirk Hall:(c) For Dupre Hall:(d) For Doty Hall: ΣΧ- ΣΧ=- (Σx- %3D
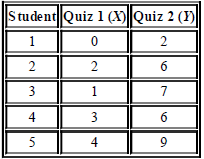
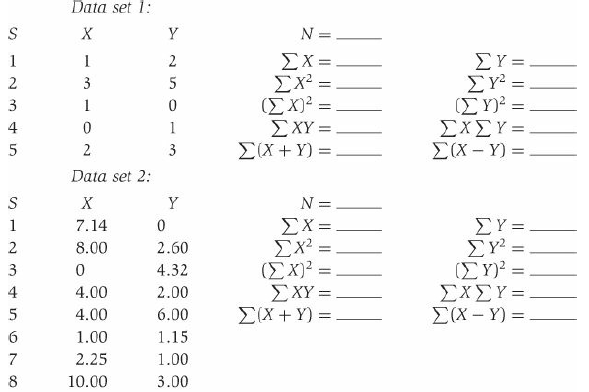
Five students are enrolled in an advanced course in psychology. Two quizzes are given early in the semester, each worth a total of 10 points. The results are as follows:(a) Compute each of the following:ΣX = ________ (ΣX)2 = ________ Σ(X ˆ’ Y) =
For each of the following (separate) sets of data, compute the values needed in order to fill in the answer spaces. Then answer the additional questions that follow.(Use the appropriate summation rule in each case so as to make the calculations easier.) Data set 1: Υ N = - ΣΥ= ΣΥ- (ΣΥ-
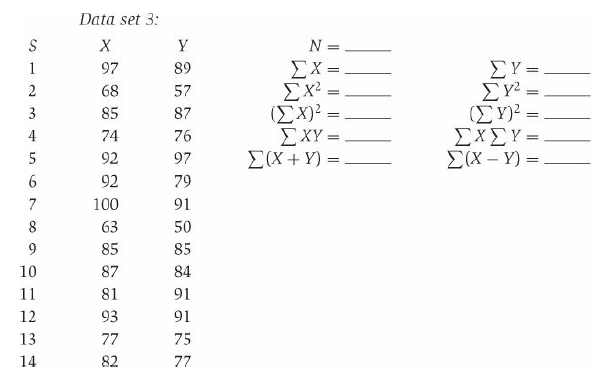
Compute the values needed to fill in the blanks. Data set 3: N =. γ ΣΧ= Σχ (Σχ)- ΣΧΥ- ΣΧ+Y )= 89 ΣΥ- ΣΥ2 (ΣΥ- ΣΧΣΥ ΣΧ-y) = 97 57 2 68 3 85 87 %3| 4 74 76 92 97 92 79 100 91 50 63 85 85 10 87 84 11 81 91 12 93 91 75 13 77 82 77 14
Create regular and cumulative frequency distributions for the data from the Turck, Kirk, and Dupre dormitories (see first exercise of Chapter 1).Data from first exerciseCompute the following (these values will not by themselves help Carrie to make a decision about the dormitories, but we will use
Create grouped and cumulative grouped frequency distributions for Turck and Kirk Halls.
Plot a histogram corresponding to the grouped frequency distribution that you created for Turck Hall in the previous exercise. What kind of distribution shape do you see?
Using the grouped frequency distributions you created for Turck and Kirk Halls in Exercise 2, plot the two corresponding frequency polygons on the same set of axes (i.e., in one graph).
Create a stem-and-leaf plot for the data from Turck Hall, using an interval size of 3.
Calculate the friendliness means of Turck, Kirk, Dupre, and Doty Halls (see first exercise of Chapter 1).Data from first exerciseCompute the following (these values will not by themselves help Carrie to make a decision about the dormitories, but we will use these values as steps in future exercises
Compute the median of Turck Hall from the regular frequency distribution you created for that dorm when solving the first exercise of Chapter 2.
Using the definitional formula, calculate the (biased) “variance” of Doty Hall in terms of deviations from the median, rather than the mean, of that distribution (just put the five scores in numerical order, and use the middle one as the median).(a) How does this “variance” compare to the
Using the results you found for Exercise 9 in Chapter 2, compute the interquartile range and SIQR for Turck Hall. Using the same methods, calculate these measures for Kirk Hall, as well.
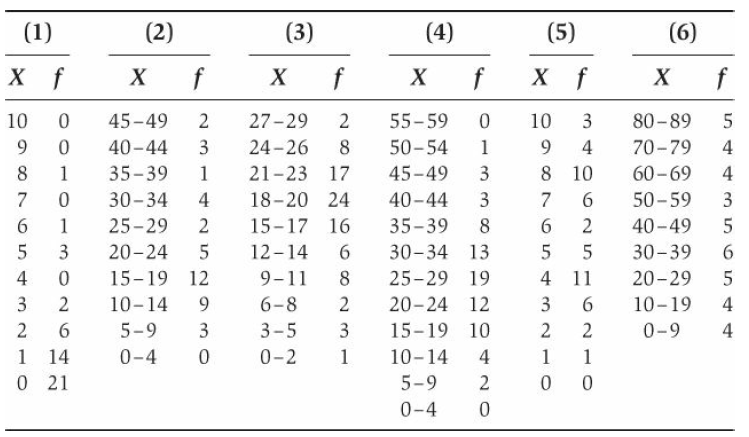
For each of the frequency distributions shown in the following table, state whether it isa. (approximately) normalb. Unimodal, skewed to the rightc. Unimodal, skewed to the leftd. Bimodal, approximately symmetrice. Bimodal, skewed to the rightf. Bimodal, skewed to the leftg. (approximately)
Use the regular (ungrouped) frequency distribution that you created for Turck Hall in Exercise 1 to solve this exercise.(a) Estimate the percentile rank corresponding to a score of 8.(b) Estimate the percentile rank corresponding to a score of 12.
Use the grouped frequency distribution that you created for Kirk Hall in Exercise 2 to solve this exercise.a. Estimate the percentile rank corresponding to a score of 16.b. Estimate the percentile rank corresponding to a score of 7.
Use the same distribution for this exercise that you used for Exercise 7.a. Approximately what score corresponds to the 25th percentile?b. Approximately what score corresponds to the 75th percentile?
Use the same grouped distribution for this exercise that you used for Exercise 8.a. Estimate the score that corresponds to the second decile.b. Estimate the score that corresponds to the 50th percentile.c. Estimate the score that corresponds to the 68th percentile.
Find the mode of Kirk Hall by inspecting the regular frequency distribution you created for that dorm when solving the first exercise of Chapter 2.
Showing 100 - 200
of 378
1
2
3
4
Step by Step Answers