New Semester
Started
Get
50% OFF
Study Help!
--h --m --s
Claim Now
Question Answers
Textbooks
Find textbooks, questions and answers
Oops, something went wrong!
Change your search query and then try again
S
Books
FREE
Study Help
Expert Questions
Accounting
General Management
Mathematics
Finance
Organizational Behaviour
Law
Physics
Operating System
Management Leadership
Sociology
Programming
Marketing
Database
Computer Network
Economics
Textbooks Solutions
Accounting
Managerial Accounting
Management Leadership
Cost Accounting
Statistics
Business Law
Corporate Finance
Finance
Economics
Auditing
Tutors
Online Tutors
Find a Tutor
Hire a Tutor
Become a Tutor
AI Tutor
AI Study Planner
NEW
Sell Books
Search
Search
Sign In
Register
study help
mathematics
statistics behavioral sciences
Introductory Statistics For The Behavioral Sciences 7th Edition Joan Welkowitz, Barry H. Cohen, R. Brooke Lea - Solutions
Using the raw data for Dupre Hall, demonstrate that the sum of the deviations from the mean equals zero.
Compute the range for each of the four dorms.
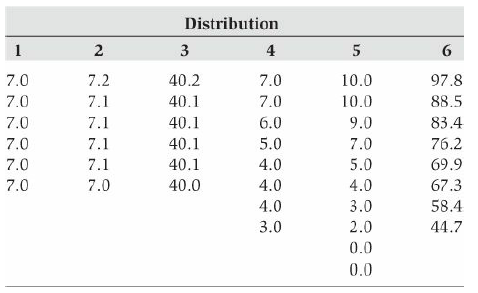
Compute the biased and unbiased standard deviations for Distribution 6 in Table 3.2.Table 3.2 Distribution 3 6. 4 7.0 7.2 40.2 7.0 10.0 97.8 7.0 7.1 40.1 7.0 10.0 88.5 7.0 7.1 40.1 6.0 9.0 83.4 40.1 5.0 76.2 7.0 7.1 7.0 5.0 7.0 7.1 40.1 4.0 69.9 7.0 7.0 40.0 4.0 4.0 67.3 58.4 4.0 3.0 3.0 2.0 44.7
The mean of a set of scores is 8 and the standard deviation is 4. What will the new mean, standard deviation, and variance be if you:a. Add 6.8 to every number?b. Subtract 4 from every number?c. Multiply every number by 3.2?d. Divide every number by 4?e. Add 6 to every number, and then divide each
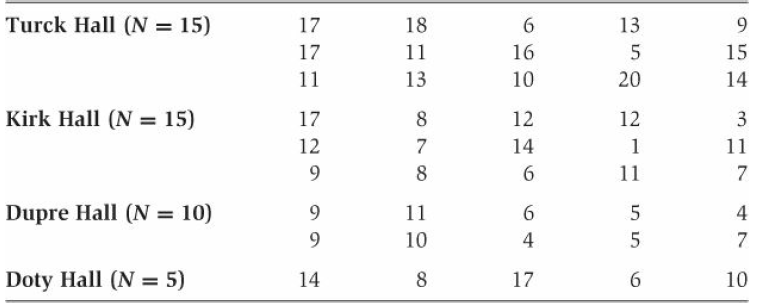
For each of the following, compute the z score; then compute the T score.a. A Turck Hall student with a score of 17.b. A Turck Hall student with a score of 11.c. A Kirk Hall student with a score of 17.d. A Kirk Hall student with a score of 11.e. A Dupre Hall student with a score of 6.f. A Doty Hall
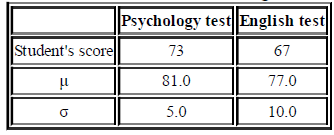
Consider the following data:This student believes that he has performed better on the psychology test for two reasons: His score is higher, and he is only 8 points below average (as opposed to 10 points below average on the English test). Convert each of his test scores to a z score. Is he right?
Which of each pair is better, or are they the same? (You should be able to answer by inspection.)a. A T score of 47 and a z score of + 0.33b. A T score of 64 and a z score of + 0.88c. A T score of 42 and a z score of −1.09d. A T score of 60 and a z score of + 1.00e. A T score of 50 and a raw
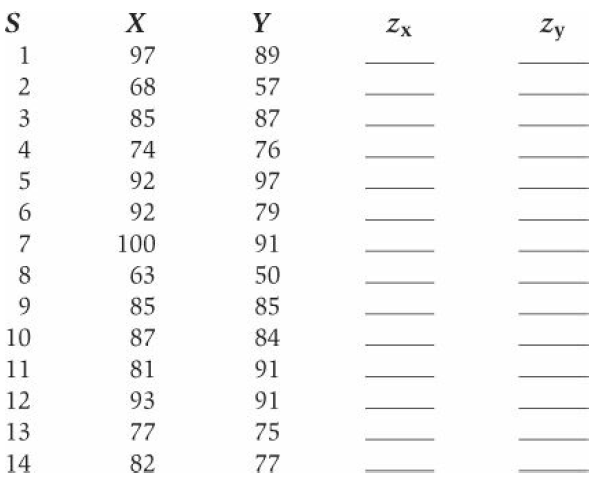
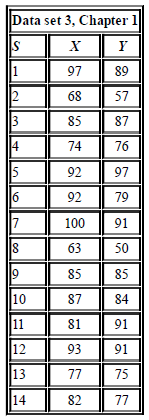
For data set 3 in Chapter 1 (reproduced here), transform each subject's (S) score on X to a z score. Then transform each subject's score on Y to a z score. х Zx Zy 97 89 2 57 68 3 85 87 4 74 76 92 97 92 79 91 100 63 8 50 9. 85 85 84 10 87 81 91 11 12 93 91 75 13 77 14 82 77
Find the mean and standard deviation (σ) for the following data set:68.36, 15.31, 77.42, 84.00, 76.59, 68.43, 72.41, 83.05, 91.07, 80.62, 77.83Transform each raw score in the preceding data set into a z score, a T score, and an SAT score. The remaining exercises are based on SAT scores, with the
What percent of the population obtains scores of 410 or less?
How do you explain the fact that the answer to Exercise 9 is smaller than the answer to Exercise 8, even though each problem deals with a 100-point range of scores?
What is the minimum score needed to rank in the top 5% of the population?
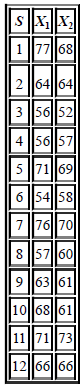
A psychology instructor develops a training method that is designed to improve the examination scores of poor students. The performance of a sample of 12 such students on the posttest (X1) following training, and the pretest (X2) prior to training, is shown.Test the null hypothesis that the
a. Convert the data in part (a) of Exercise 3 to ranks, separately for each variable, in order to compute the Spearman rank-order correlation coefficient. Test rS for statistical significance by using Table I. Compare rS to the Pearson r that you calculated for Exercise 3, part (a).b. Redo part (a)
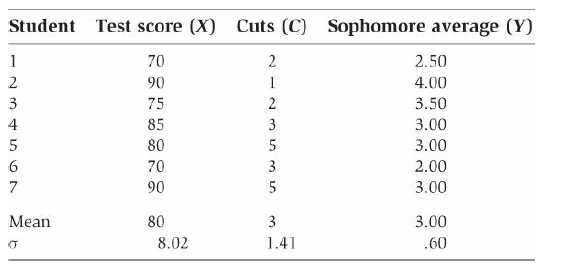
Use the data and your results from Exercise 1 in Chapter 9 to compute the linear regression equation for predicting the sophomore average (Y) from the number of cuts (C). What sophomore average would be predicted for a student who cut class eight times during the semester in question?
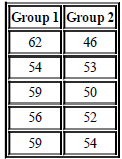
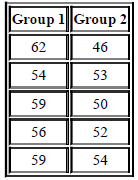
The following data come from Exercise 5 in Chapter 7. Calculate rpbfor these data by assigning an X value of 0 to Group 1 and an X value of 1 to Group 2. What proportion of the variance in the scores is accounted for by group membership? Group 1 Group 2 62 46 54 53 50 59 56 52 59 54
Calculate the power for the tests you conducted for Turck and Kirk Halls in Exercise 1 of Chapter 6. (Use the t values you calculated for that exercise as the values for δ in your power calculation.)Data from exercise 1 (chapter 6)Answer these problems by calculating a t value and comparing it to
If the sample r you calculated in Exercise 2 of Chapter 9 was equal to ρ for the population, how large a sample would you need to obtain power = .7 for a two-tailed test at the .05 level?
Suppose that you plan to match students between Turck and Kirk Halls so that the population correlation corresponds to .4. Given the d you found in part (b) of Exercise 6 and the sizes of the samples from Turck and Kirk Halls, how much power would you have for a two-tailed matched-pairs t test at
Recalculate the required sample sizes for part (a) of Exercise 7 if the two populations are matched with ρ = .6.Data from exercise 7a. Calculate g for the comparison of the means of Turck and Kirk Halls (if you did not already calculate that value for Exercise 1 of Chapter 7). Use g as your
Using the means and standard deviations you have already calculated for the data from the four dormitories (i.e., Turck, Dirk, Dupre, and Doty Halls), perform an analysis of variance to decide whether you can reject the null hypothesis that the four samples come from populations with identical
Calculate LSD for the two experiments in Exercise 1 of the previous chapter. For which experiment is the calculation of LSD justified? Determine which pairs of means differ significantly in the experiment for which the calculation of LSD is justified.Data from exercise 1(previous chapter)Following
Calculate protected t tests to compare all possible pairs of the four dormitories (e.g., Turck, Kirk, etc.), using the error term for Exercise 2 of the previous chapter. Which pairs differ significantly at the .05 level? Give two reasons why it would not be appropriate to calculate LSD for the data
What percent of the population obtains scores between 430 and 530?
What percent of the population obtains scores between 275 and 375?
A psychologist wishes to test a new learning strategy on the bottom 15% of those who took the math SAT. What cutoff score should she use to select participants for her study?
A single student is drawn at random from the population. What is the probability that this student has a score:a. Of 410 or less?b. Between 430 and 530?c. Between 275 and 375?d. In the top 5% of the population?Base your answers to this exercise on the percentages you found for the previous
Between which two SAT scores would you find the middle:(a) 70% of the normal distribution?(b) 90% of the normal distribution?
Assume that the mean height for women at a large American university (to be viewed as a population) is 65 inches with a standard deviation of 3 inches.a. If the women are placed randomly into physical education classes of 36 each, what will be the SD of the class means for height (i.e., the
Assume that the mean IQ for all 10th graders at a large high school (i.e., population) is 100 with σ = 15 and that the students are assigned at random to classes with an N of 25.a. What is the z score for a class whose IQ averages 104? What is the one-tailed p value for this z score? What is the
Given that for SAT scores, μ = 500 and σ = 100:a. Test the claim of students at Bigbrain University that they have SAT scores that are statistically significantly higher than the ordinary population, because a random sample of 25 of their students averaged 530 on this test. Make your statistical
Referring to the 20-point friendliness measure used in the first exercise of Chapter 1, assume that the mean score for all American college students is known to be 10, with a SD of 5 points.a. Based on the data in Table 1.1, what is the z score for friendliness for the students sampled from Turck
Repeat Exercise 4, parts (a) and (b), for the sample from Dupre Hall. What is the same and what is different between your calculations for this exercise, and your calculations for Exercise 4?Data from exercise 4a. Based on the data in Table 1.1, what is the z score for friendliness for the students
This exercise is designed to give you a more direct understanding of the standard error of the mean. Create a population as follows: Get 20 identical small slips of paper or file cards. On eight of these slips, write the number 50; on five of the slips, write the number 51; on another five, write
Calculate the mean and (unbiased) SD for the following sample: 5, 10, 15, 20, 25, 30, 35, 40, 45, 50, 50, 55, 60, 65, 70, 75, 80, 85, 90, 95. Assume that the SD of the population from which these data were sampled is the same as the SD that you just calculated for the sample.(a) Are these data
Answer these problems by calculating a t value and comparing it to the critical value for a two-tailed test at the .05 level. (Note: You can save time by using the means and standard deviations you calculated for the dormitories called Turck and Kirk Halls for previous exercises.)a. Would you
For Kirk Hall, compute each of the following:a. The 99% CI.b. The 95% CI.c. The 90% CI.d. Explain why the size of the CIs becomes larger as the level of confidence increases.
This exercise is based on the following data set: 1, 3, 6, 0, 1, 1, 2, 1, 4.a. Perform a t test in order to decide whether you can reject the null hypothesis of μ = 2.5 at the .05 level (two tailed) for these data.b. Redo your t test in part (a) for a null hypothesis of μ = 6.0.c. Compute the 95%
This exercise is based on the following data set: 68.36, 15.31, 77.42, 84.00, 76.59, 68.43, 72.41, 83.05, 91.07, 80.62, 77.83.a. Perform a t test in order to decide whether you can reject the null hypothesis of μ = 52.3 at the .01 level (two-tailed) for these data.b. Redo your t test in part (a)
A politician has staked his political career on whether a new state constitution will pass. To find out which way the wind is blowing, he obtains a random sample of 100 voters a few weeks prior to the election and finds that 60% of the sample says that they will vote for the new constitution.
A certain business concern needs to obtain at least 20% of the market in order to make a profit. A random sample of 200 prospective buyers is asked whether they will purchase the product. What should the company conclude if (find the 95% CI in each case, in addition to performing the null
Use the two-sample t test to determine whether the difference in means between Turck and Kirk Halls is significant at the .05 and .01 levels, two-tailed. Given your decision with respect to the null hypothesis, which type of error could you be making: Type I or Type II? Report the results of your t
Repeat the previous exercise, except that this time compare Turck Hall to Dupre Hall. Would the t value based on the separate-variances formula (7.8) be smaller or larger than the pooled-variances t value?Data from previous exerciseUse the two-sample t test to determine whether the difference in
Repeat Exercise 2, but this time compare Kirk Hall to Dupre Hall, and conduct only a one-tailed test at the .05 level, assuming that Kirk will have the larger mean.Data from exercise 2Repeat the previous exercise, except that this time compare Turck Hall to Dupre Hall. Would the t value based on
An industrial psychologist obtains scores on a job-selection test from 41 men and 31 women, with the following results: men, M = 48.75(SD = 9.0); women, M = 46.07(SD = 10.0). Test this difference for significance at both the .05 and .01 levels (two-tailed). Determine the effect size for the
Suppose that the industrial psychologist from the previous exercise is testing the difference in performance on the job-selection test of two different ethnic groups. Given the following data, can the psychologist reject the null hypothesis (alpha = .05) that the population means of these two
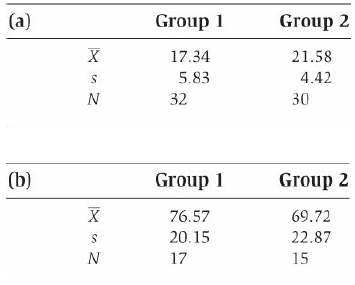
Repeat Exercise 5 for the following two sets of summary statistics. In each case, determine if the results would be significant for a one-tailed as well as a two-tailed test, but compute the CI only if the two-tailed test is significant. Regardless of statistical significance, compute g, the
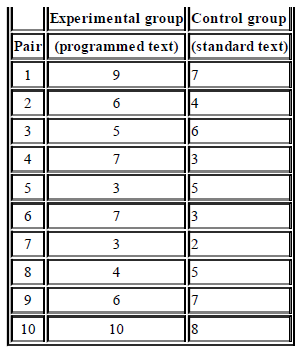
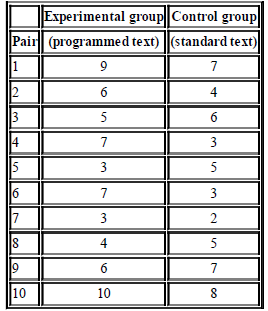
An educational psychologist has developed a new textbook based on programmed instruction techniques and wishes to know if it is superior to the conventional kind of textbook. He therefore obtains participants who have had no prior exposure to the material and forms two groups: an experimental
For the following set of data, assume that the X score represents the participant's performance in the experimental condition and that the Y score represents the same person's performance in the control condition. (Thus, each participant serves as his or her own control.) Compute the matched t test
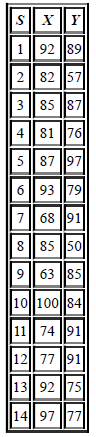
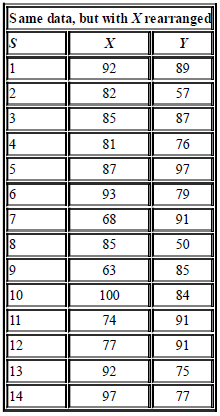
Now carry out a matched t test for the same set of data as in Exercise 8, but with the X values rearranged as shown. 1| 92 ||89 2|| 82 ||57 3 || 85 ||87 4 || 81 ||76 587 ||97 6| 93 ||79 7 68 |91 8|| 85 ||50 9 || 63 ||85 10||100||84 11| 74 ||91 12 || 77 |91 13|| 92 ||75 14| 97 ||77
Suppose that you have read the following sentence in a psychology journal: “The experimental group obtained a higher score on the recall task (M = 14.7) than did the control group (M = 11.1), and this difference was statistically significant, t(38) = 2.3, p < .05.” Assuming that the two
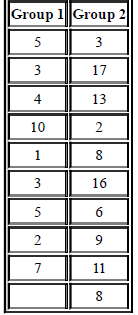
An operator of a certain machine must turn it off quickly if a danger signal occurs. To test the relative effectiveness of two types of signals, a small group of operators is randomly divided into two groups. Those in Group 1 operate machines with a newly designed signal, while those in Group 2 use
Redo Exercise 5 from Chapter 7 using the rank-sum test instead of a t test. Does your statistical conclusion differ from the one you made in the previous chapter? Why would the rank-sum test not be very accurate for the data in that exercise?Data from exercise 5Suppose that the industrial
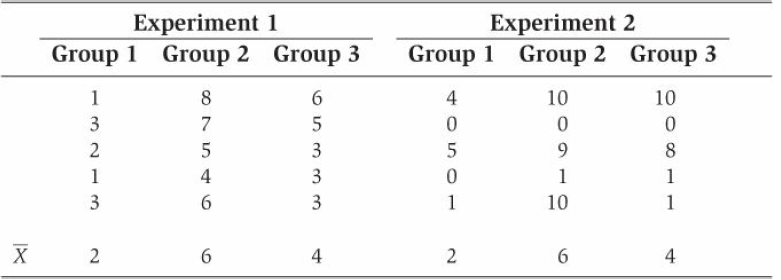
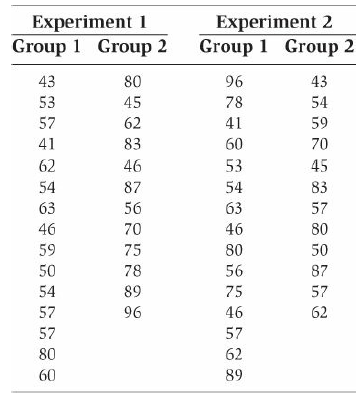
In Experiment 1 (see the following table), Ihno is comparing scores on a practice final exam between the students who performed most poorly on the midterm (Group 1) and those who got the highest midterm scores (Group 2). Experiment 2 also compares scores on the practice final, but in this case,
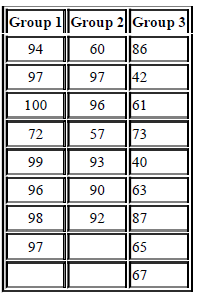
A psychology professor uses three different methods of instruction in three small classes, with the assignment of students to classes being random, and gives each class the same final examination. The results are in the table that follows.(a) Perform the appropriate test to compare each possible
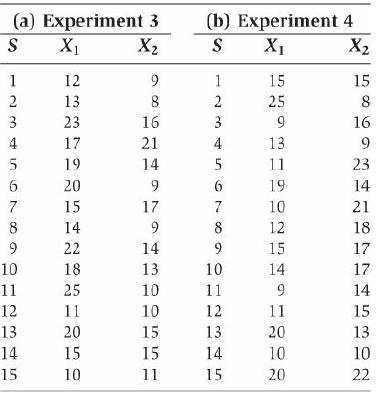
For each of the two (separate) experiments that follow, perform the Wilcoxon test. If an experiment yields statistically significant results, also compute rc. (b) Experiment 4 X1 (a) Experiment 3 X1 X2 X2 15 12 15 13 2 25 3 23 16 16 4 17 21 4 13 9. 19 14 5 11 23 20 19 14 15 17 10 21 9. 14 8 12 18
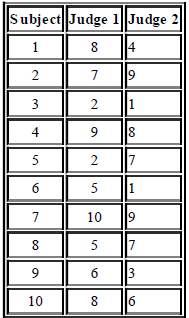
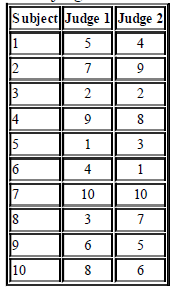
Ten subjects participate in a problem-solving experiment. Two judges are asked to rate the solutions with regard to their creativity (1 = most creative, 10 = least creative). The experimenter wishes to know if the judges were equally lenient in their ratings. Given the ratings in the table, what
A college dean would like to know how well he can predict sophomore grade point average for first semester freshmen so that students who are headed for trouble can be given appropriate counseling. After students have been in school for one semester, the dean obtains their numerical final
The data from Exercise 7 in Chapter 7 are reproduced in the following table. Calculate the mean and the unbiased standard deviations for both the experimental and control groups, and then compute the Pearson r with the raw-score formula that uses the s's rather than the σ's in its
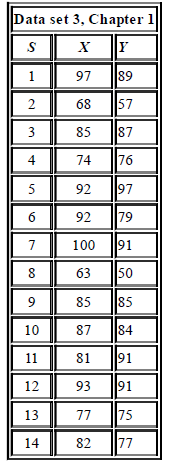
The data from Exercises 8 and 9 in Chapter 7 are reproduced in the tables that follow.a. Compute the Pearson r for Data Set 3, Chapter 1, and test for significance at the .01 level.b. Use the z scores you calculated for these data in the exercises of Chapter 4 to recompute the r with the zproduct
Ten subjects participate in a problem-solving experiment. Two judges are asked to rank order the solutions with regard to their creativity (1 = most creative, 10 = least creative). The experimenter wishes to know if the judges are in substantial agreement. Following are the rankings; what should
Compute the linear regression equation for predicting Y from X for each of the data sets in Exercise 3 in Chapter 9. What proportion of the variance in Y is accounted for by X in each data set? For each data set, use the appropriate formula to calculate the unbiased standard error of the estimate
Use the t value you calculated for Exercise 1 in Chapter 7 to find the point-biserial r that corresponds to the difference in means between Turck and Kirk Halls. Then use the appropriate t formula to test the rpb you just computed for significance. How does this t value compare with the
An industrial psychologist obtains scores on a job-selection test from 41 men and 31 women, with the following results (see Exercise 4 in Chapter 7): men, M = 48.75 (SD = 9.0); women, M = 46.07 (SD = 10.0). First, calculate g for these data. Then use the appropriate formula to calculate rpb
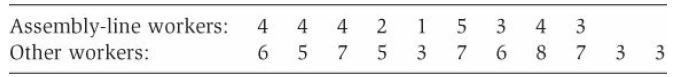
Another industrial psychologist asks a group of 9 assembly-line workers and 11 workers not on an assembly line (but doing similar work) to indicate how much they like their jobs on a 9-point scale (9 = like, 1 = dislike). The results are as follows:(a) Test the null hypothesis that there is no
Suppose that the students at Bigbrain University are planning to test whether the mean math SAT score for their school is higher than the national average (μ) of 500 (assume that σ = 100). a. If they believe that their mean is 520, and they plan to sample 25 students, what is the power of their
a. A politician needs 50% or more of the vote to win an election. To find out how his campaign is going, he plans to obtain a random sample of 81 voters and see how many plan to vote for him. He is willing to posit a specific alternative hypothesis of 60% (or 40%) and wishes to use the .01
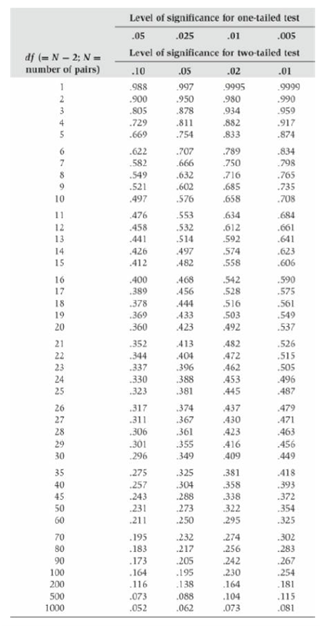
a. A personality theorist expects that two particular traits have a linear correlation on the order of .40 in the population she plans to sample. She wishes to test the null hypothesis that the correlation between the two traits is exactly zero, using the .05 criterion of significance and a random
a. Calculate g for the comparison of the means of Turck and Kirk Halls (if you did not already calculate that value for Exercise 1 of Chapter 7). Use g as your estimate of d, and compute the sample sizes you would need for power = .75, for a .05 two-tailed test, comparing the two dormitories.b.
a. Calculate g from the pooled-variance t value you computed to solve Exercise 2 in Chapter 7. Use that value for g as your estimate of d, and compute the sample sizes you would need for power = .9, for a .05 two tailed test, assuming that you plan to use two equal-size samples to compare Turck and
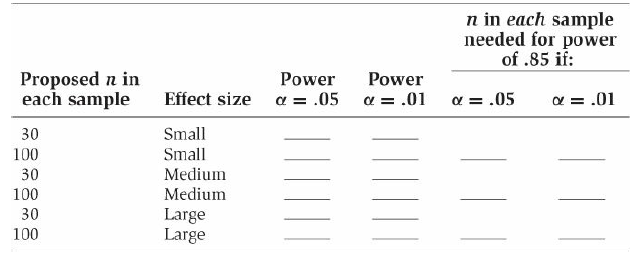
Calculate the missing values in the following table, assuming that you are comparing two independent, equalsize samples with a two-tailed t test. (Note: Small = .2, Medium = .5, Large = .8.) n in each sample needed for power of .85 if: Proposed n in each sample Power Power a = .01 a = .05 a = .01
a. Calculate the power your test would have in Exercise 7 of Chapter 7 if the two sets of scores were not correlated at all in the population (use g for those data as d in your power calculation).b. Calculate the power your test would have in Exercise 7 of Chapter 7 if the two sets of scores had a
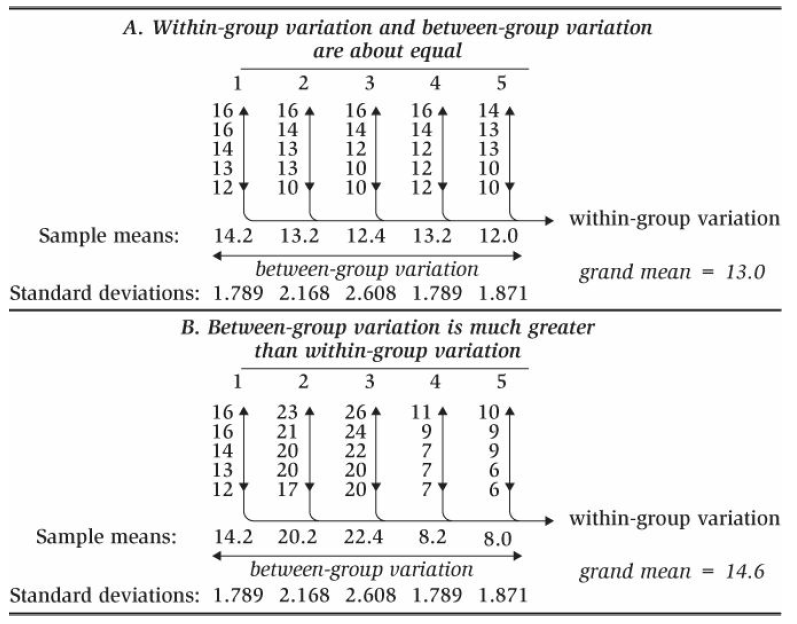
Following are two separate (hypothetical) sets of data that are somewhat exaggerated to help clarify the procedures underlying analysis of variance. In each case, the experimenter is interested in conditions that affect the number of errors made by participants on a simple clerical task that must
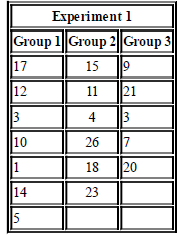
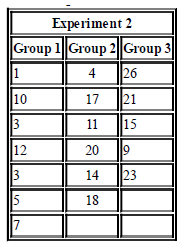
For each of the following two experiments, calculate the means and variances for each group first, and then use those statistics to perform the ANOVA.a. Can you reject the null hypothesis for Experiment 1? Display your results in an ANOVA summary table, and state the significance of your F ratio in
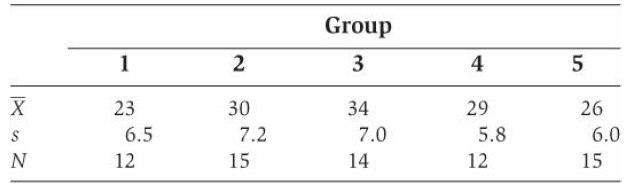
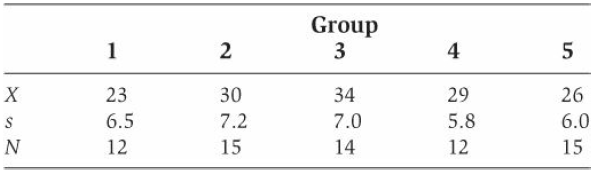
Calculate the one-way ANOVA and determine its statistical significance for the following data: Group 2 4 23 х 30 7.2 34 29 26 5.8 6.0 6.5 7.0 14 12 15 12 15
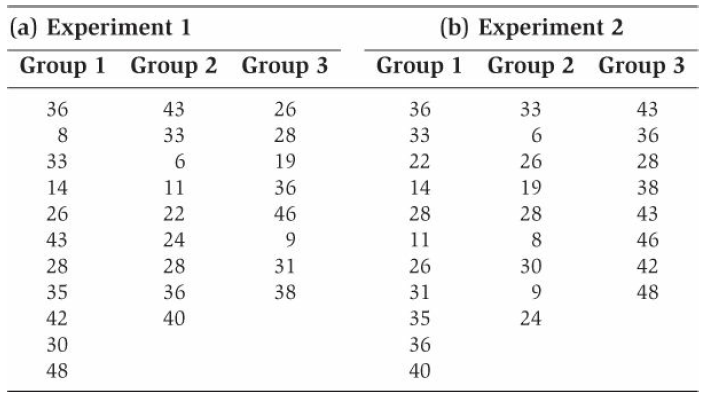
For each of the two (separate) experiments that follow, perform the Kruskal-Wallis H test. If an experiment yields statistically significant results, compute the appropriate eta squared. (a) Experiment 1 (b) Experiment 2 Group 1 Group 2 Group 3 Group 1 Group 2 Group 3 33 26 36 43 36 43 33 8 33 28
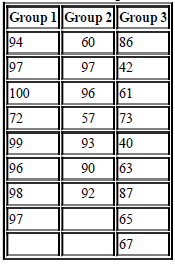
The following data table comes from Exercise 4 in Chapter 8, in which a psychology professor used three different methods of instruction in three small classes. In Chapter 8 you were asked to compare each pair of groups with the nonparametric rank-sum test. This time we would like you to:(a) Test
Consider the following hypothetical results, as published in a hypothetical journal: “The participants had been divided equally among three experimental conditions negative feedback, positive feedback, and no feedback —and the mean scores for the three groups at the end of the study were 11.1,
Calculate both LSD and HSD for the two experiments in Exercise 3 of the previous chapter, using the harmonic mean of the three sample sizes as your value for n. What conclusions can you draw for each experiment? Use your values for LSD and HSD to compare the relative statistical power of these two
For your convenience, the data from Exercise 4 from the previous chapter are reprinted in the following table:a. Using the harmonic mean of all the sample sizes as your value for n, calculate HSD for these data, and determine which pairs of groups differ significantly.b. Recalculate HSD according
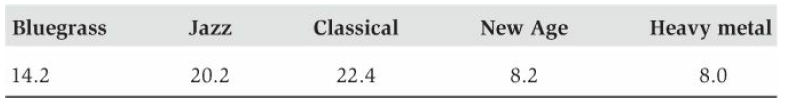
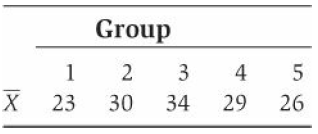
A study using five samples finds that the mean of each sample is as follows: Sample 1 = 6.7; Sample 2 = 14.2; Sample 3 = 13.8; Sample 4 = 10.4; Sample 5 = 15.8. Suppose that HSD (with q based on α = .05) for this study is 5.3.(a) Which population means should be regarded as different from each
For this exercise, we will use Table 13.4, reprinted here, for the sample means. This time, however, imagine that the size of each sample (n) is 7 and that you do not know MSW. Fortunately, you are given the results of the ANOVA: F(4, 30) = 5.53.Table 13.4 Means for the Music Experiment Data in
In Exercise 7 of the previous chapter, the means for the negative feedback, positive feedback, and no feedback groups were X̅neg = 11.1, X̅pos = 14.7, and X̅no = 12.4, and the F ratio for the one-way ANOVA was equal to 3.69. Given that the ANOVA was significant at the .05 level and that there
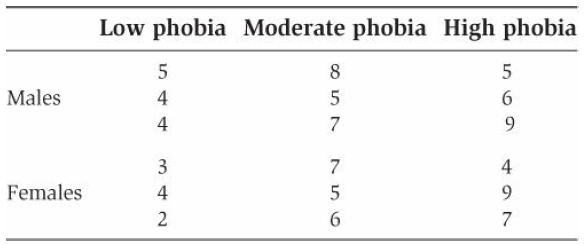
The following table contains the statistics quiz scores for 18 students as a function of their phobia level and gender.a. Compute the two-way ANOVA for these data, and present your results in the form of an ANOVA summary table (see Table 14.2).b. Conduct the appropriate follow-up tests to determine
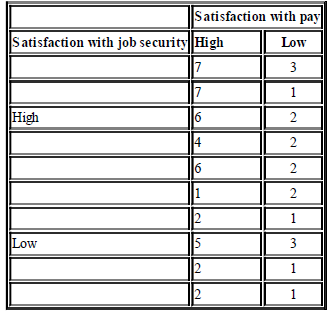
An industrial psychologist wishes to determine the effects of satisfaction with pay and satisfaction with job security on overall job satisfaction. He obtains measures of each variable for a total group of 20 employees, and the results are shown in the following table. (Cell entries represent
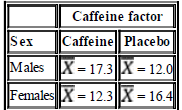
Suppose that a 2 × 2 factorial design is conducted to determine the effects of caffeine and sex on scores on a 20-item English test. The cell means are given in the following table.a. Given that n = 7 and MSW = 2.0, compute the appropriate F ratios, and test each for significance at
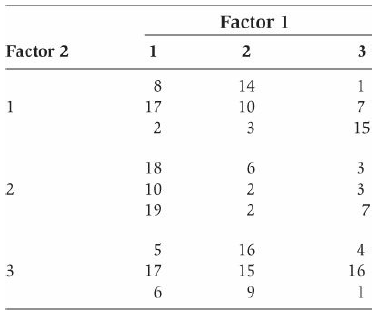
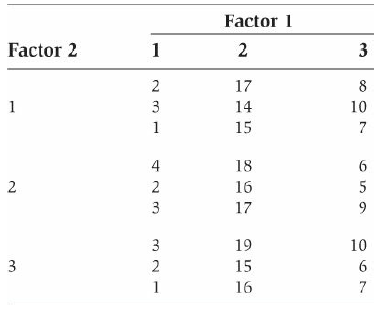
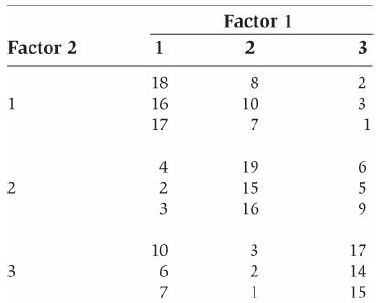
For each of the following experiments, perform a two-way ANOVA and then the follow-up tests that are appropriate for your results. Use a graph of the cell means to explain the results you obtained.a. Experiment 1b. Experiment 2c. Experiment 3 Factor 1 Factor 2 3 8 14 17 10 3 15 18 3 10 2 3 19 2 7
Redo Exercise 7 from Chapter 7 as a one-way RM ANOVA. What is the relationship between the F ratio you calculated for this exercise and the t value you calculated for that exercise?Data from exercise 7 (chapter 7)An educational psychologist has developed a new textbook based on programmed
The following group means come from Exercise 4 in Chapter 12. Compute the one-way RM ANOVA for these data, assuming that there are a total of 15 blocks of (matched) participants and that SSerror = 5, 40. Is the F ratio significant at the .05 level, based on the unadjusted df (i.e., assuming
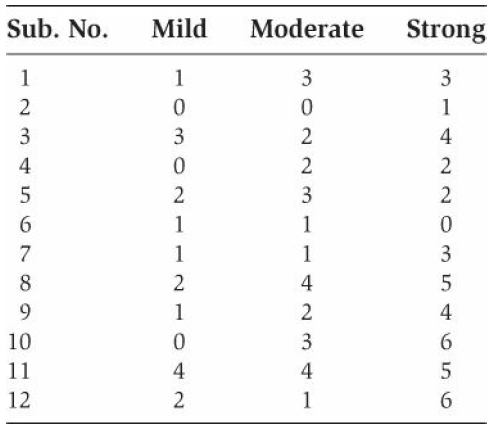
The following data come from an experiment in which each participant has been measured under three different levels of distraction (the DV is the number of errors committed on a clerical task during a 5-minute period). Compute the one-way RM ANOVA for these data. Is the F ratio significant at the
Suppose that, prior to performing the clerical tasks in the experiment of Exercise 3, the first six participants took pills they thought to be caffeine but that were actually placebos; the remaining six participants ingested real caffeine pills.a. Reanalyze the data in Exercise 3 as a mixed-design
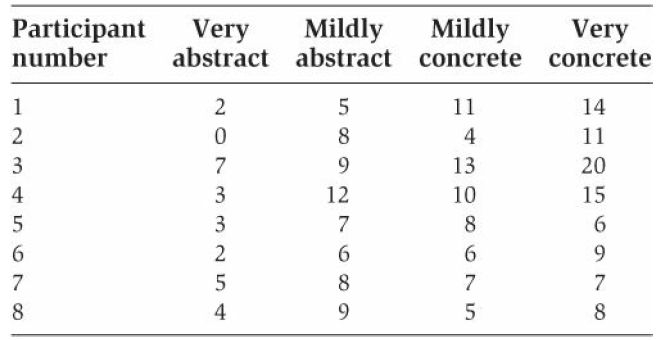
Suppose that participants are asked to memorize a list of words that range from very abstract to very concrete. The number of words recalled of each type for each participant are shown in the following table.a. Compute the one-way RM ANOVA for these data. Test the F ratio for significance at the
In the following problems, cards are drawn from a standard 52-card deck. Before a second draw, the first card drawn is replaced and the deck is thoroughly shuffled. Compute each of the following probabilities.a. The probability of drawing a 10 on the first draw.b. The probability of drawing either
The following questions refer to the throw of one fair, six-sided die.a. What is the probability of obtaining an odd number on one throw?b. What is the probability of obtaining seven odd numbers in seven throws?
One hundred slips of paper bearing the numbers from 1 to 100, inclusive, are placed in a large hat and thoroughly mixed. What is the probability of drawinga. The number 17?b. The number 92?c. Either a 2 or a 4?d. A number from 7 to 11, inclusive?e. A number in the 20s?f. An even number?g. An even
Slips of paper are placed in a large hat and thoroughly mixed. Ten slips bear the number 1, 20 slips bear the number 2, 30 slips bear the number 3, and 5 slips bear the number 4. What is the probability of drawinga. A 1?b. A 2?c. A 3?d. A 4?e. A 1 or a 4?f. A 1 or a 2 or a 3 or a 4?g. A 5?h. A 2
Imagine that you want to test whether a particular coin is biased or fair by flipping the coin four times and counting the number of times it comes up heads.a. How many different sequences can be produced by flipping the coin four times? How many different values can X (the number of heads) take
Apply the sign test to the data from Exercise 8 in Chapter 7, using one of the normal approximation formulas. Explain the difference in results between this exercise and the one in Chapter 7.Data from exercise 8 (chapter 7)For the following set of data, assume that the X score represents the
Suppose that after 6 months of a new form of treatment for chronic schizophrenia, 18 patients exhibited some improvement, 4 did not change, and 6 patients actually got worse.a. Using the sign test, can you reject the null hypothesis (that the new treatment has no effect) at the .05 level? (Show the
Out of 100 psychiatric patients given a new form of treatment, 60 improved, while 40 got worse.a. Use a chi-square test to decide whether you can reject the null hypothesis that the treatment is totally ineffective (i.e., that patients are equally likely to improve or get worse).b. Redo the
Showing 200 - 300
of 378
1
2
3
4
Step by Step Answers