New Semester
Started
Get
50% OFF
Study Help!
--h --m --s
Claim Now
Question Answers
Textbooks
Find textbooks, questions and answers
Oops, something went wrong!
Change your search query and then try again
S
Books
FREE
Study Help
Expert Questions
Accounting
General Management
Mathematics
Finance
Organizational Behaviour
Law
Physics
Operating System
Management Leadership
Sociology
Programming
Marketing
Database
Computer Network
Economics
Textbooks Solutions
Accounting
Managerial Accounting
Management Leadership
Cost Accounting
Statistics
Business Law
Corporate Finance
Finance
Economics
Auditing
Tutors
Online Tutors
Find a Tutor
Hire a Tutor
Become a Tutor
AI Tutor
AI Study Planner
NEW
Sell Books
Search
Search
Sign In
Register
study help
mathematics
statistics for management
Statistics For Management And Economics 11th Edition Gerald Keller - Solutions
The random variable in Exercise 7.30 was the number of stores entered by customers at a mall. Suppose that the random variable is Poisson distributed with a mean of 4.a. What proportion of mall customers enter 5 stores or more?b. Compute the probability that a customer enters 3 or fewer stores.c.
At a public library one of the librarians surveys individuals reading online newspapers. After analyzing the data she concludes that the number of newspapers read online is Poisson distributed with a mean of 5.a. What proportion of library patrons read 3 or fewer newspapers online?b. What
The random variable in Exercise 7.44 was the number of holes in one by the members of a private golf course. In fact, the number of holes in one is Poisson distributed with a mean of 1.a. What proportion of members never have had a hole in one?b. What proportion have score 5 or more holes in one?
After conducting a survey of golfers a statistician concludes that the number of lost balls in a round is Poisson distributed with a mean of 2. Find the probability of the following events.a. A golfer loses no golf ballsb. A golfer loses 4 or more no golf ballsc. A golfer loses 2 or fewer golf balls
In a Gallup poll 20% of adults said that they had a great deal or quite a lot of confidence in newspapers. If we take a random sample of 25 adults and ask each whether they had a great deal or quite a lot of confidence in newspapers determine probability of each of these events.a. 5 or fewer have
A recent Pew Center Research survey revealed that 15% of American adults have used an online dating service. Suppose a statistician randomly selected 20 American adults.a. What is the probability that exactly 3 used an online dating service?b. What is the probability that 5 or fewer used an online
An airline boasts that 77.4% of its flights were on time. If we select five flights at random, what is the probability that all five are on time?
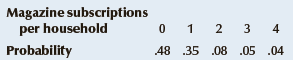
The number of magazine subscriptions per household is represented by the following probability distribution.a. Calculate the mean number of magazine subscriptions per household.b. Find the standard deviation. Magazine subscriptions per household Probability 3 4 48 .35 .08 .05 .04 3.
The distribution of the number of home runs in soft-ball games is shown here.a. Calculate the mean number of home runs.b. Find the standard deviation. Number of home runs 0 1 2 3 4 5 .05 .16 41 .27 .07 .04 Probability
The Powerball lottery is one of the most popular lotteries in the United States. From time to time, the jackpot exceeds $100 million. As a result so many more people buy Powerball tickets that there are frequent lineups at convenience stores. A statistician interviews hundreds of people in queues
Ten percent of American adults devote so much time to playing video games either on a console, computer, or cell phone that they consider themselves to be “gamers” according to a Pew Research Center report. Suppose that a random sample of 25 American adults is drawn and each is asked whether
University and college students are relatively confident about finding a job after graduation. According to a Gallup survey 50% of students are say now is a good time to find a quality job. Suppose you randomly select 10 students and ask about their future job prospects.a. What is the probability
Many cell phone service providers offer family plans wherein parents who subscribe can get discounts for other family members. Suppose that the number of cell phones per family is Poisson distributed with a mean of 1.5. If one family is randomly selected calculate the following probabilities.a.
In 1941 Joe DiMaggio hit in 56 consecutive games, a record that is predicted to never be broken. To see how unlikely this streak was, assume that a player batting .350 gets to bat 5 times in a game (with no walks and hit by pitch).a. What is the probability that the player will get at least one hit
In Basketball players are awarded free throw when they are fouled. Suppose that a player has a career percentage of making free throws 80% of the time. If the player is awarded 10 free throws determine the probability of the following events. a. He makes all 10.b. He makes 8 or more.c. He
An investor hears a radio report that says in 60% of the stocks on the New York Stock Exchange increased in value. He realizes that he owns 20 stocks on the NYSE. Determine the probability of the following events.a. 15 or more stocks increased in value.b. 12 or fewer stocks increased in value.c. 12
According to a Gallup Poll conducted in 2015 only 1% of Russians approved of U.S. leadership. To evaluate whether this claim has any merit a statistician took a random sample of 100 Russians. Determine the probability of these events.a. No one approved of U.S. leadership.b. One Russian approved of
a. Adobe (ADBE): 25%, Cisco Systems (CSCO): 25%, Comcast (CMCSA): 25%, Garmin (GRMN): 25%b. ADBE: 40%, CSCO: 10%, CMCSA: 40%, GRMN: 10%c. ADBE: 10%, CSCO: 20%, CMCSA: 30%, GRMN: 40%d. Which portfolio would a gambler choose? Explain.e. Which portfolio would a risk-averse investor choose? Explain.
Refer to Exercise 7.92.a. Compute the expected value and variance of the portfolio described next. BNS: 44.0%, CNR: 27.5%, CTC.A: 21.9%, MG: 6.6%b. Can you do better? That is, can you find a portfolio whose expected value is greater than or equal to 1% and whose variance is less than the one you
a. Agnico Eagle (AEM): 25%, Canadian Imperial Bank of Commerce (CM): 25%, Canadian Tire (CTC.A): 25%, Royal Bank (RY): 25%b. AEM: 10%, CM: 20%, CTC.A: 60%, RY: 10%c. AEM: 10%, CM: 10%, CTC.A: 10%, RY: 70%d. Which portfolio would a gambler choose? Explain.e. Which portfolio would a risk-averse
a. Bank of Nova Scotia (BNS): 25%, Sun Energy (SU): 25%, Telus (T): 25%, George Weston (WN): 25%b. BNS: 10%, SU: 10%, T: 70%, WN: 10%c. BNS: 10%, SU: 50%, T: 10%, WN: 30%d. Which portfolio would a gambler choose? Explain.e. Which portfolio would a risk-averse investor choose? Explain.
a. Bank of Montreal (BMO): 25%, Magna International (MG): 25%, Power (POW): 25%, Rogers Communication (RCL.B): 25%b. BMO: 20%, MG: 60%, POW: 10%, RCL.B: 10%c. BMO: 10%, MG: 20%, POW: 30%, RCL.B: 40%d. Which portfolio would a gambler choose? Explain.e. Which portfolio would a risk-averse investor
Refer to Exercise 7.85. Compute the correlation matrix of the returns of the four banks. Briefly describe what the correlations tell you.In exercise 7.85An analyst recommends that you invest in a portfolio made up of Bank of Montreal (BMO), Bank of Nova Scotia (BNS), Canadian Imperial Bank of
a. Canadian National Railway (CNR): 10%, Enbridge (ENB): 40%, Loblaw (L): 40%, Manulife Financial (MFC): 10%b. CNR: 50%, ENB: 30%, L: 10%, MFC: 10%c. CNR: 70%, ENB: 10%, L: 10%, MFC: 10%d. Which portfolio would a gambler choose?Explain.e. Which portfolio would a risk-averse investor choose? Explain.
a. Agnico Eagle (AEM): 25%, Bell Canada Enterprises (BCE): 25%, Bank of Montreal (BMO: 25%, Dollarama (DOL): 25%b. AEM: 30%, BCE: 30%, BMO: 20%, DOL: 20%c. AEM: 40%, BCE: 15%, BMO: 15%, DOL: 30%d. Explain why the choice of which portfolio to invest in is obvious.
An analyst recommends that you invest in a portfolio made up of Bank of Montreal (BMO), Bank of Nova Scotia (BNS), Canadian Imperial Bank of Commerce (CM), and Royal Bank (RY). Why would it not useful in diversification?
Refer to Exercise 7.82.In exercise 7.82a. United Health (UNH): 25%, United Technologies (UTX): 25%, Verizon (VZ): 25%, Walmart (WMT): 25%b. UNH: 10%, UTX: 20%, VZ: 30%, WMT: 40%c. UNH: 40%, UTX: 30%, VZ: 20%, WMT: 10%d. Which portfolio would a gambler choose? Explain.e. Which portfolio would a
a. United Health (UNH): 25%, United Technologies (UTX): 25%, Verizon (VZ): 25%, Walmart (WMT): 25%b. UNH: 10%, UTX: 20%, VZ: 30%, WMT: 40%c. UNH: 40%, UTX: 30%, VZ: 20%, WMT: 10%d. Which portfolio would a gambler choose? Explain.e. Which portfolio would a risk-averse investor choose? Explain.
a. Chevron (CVX): 25%, du Pont (DD): 25%, Procter & Gamble (PG): 25%, Travelers (TRV): 25%b. CVX: 50%, DD: 20%, PG: 15%, TRV: 15%c. CVX: 10%, DD: 20%, PG: 30%, TRV: 40%d. Explain why the choice of which portfolio to invest in is obvious.
a. Coca Cola (KO): 40%, Pfizer (PFE): 20%, Verizon Communications (VZ): 40%b. KO: 60% PFE: 20%, (VZ): 20%c. KO: 10%, PFE: 30%, VZ: 60%d. Which portfolio would a gambler choose? Explain.e. Which portfolio would a risk-averse investor choose? Explain.
a. General Electric (GE): 25%, Johnson & Johnson (JNJ): 25%, McDonald’s (MCD): 25%, Merck (MRK): 25%b. GE: 5%, JNJ: 30%, MCD: 40%, MRK: 25%c. GE: 10%, JNJ: 50%, MCD: 30%, MRK: 10%d. Which portfolio would a gambler choose? Explain.e. Which portfolio would a risk-averse investor choose? Explain.
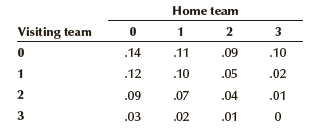
Refer to Exercise 7.63.In exercise 7.63After watching several seasons of soccer a statistician produced the following bivariate distribution of scores.a. Determine the probability distribution of the home team scores.b. Calculate the mean, variance, and standard deviation of the home team scores.
After watching several seasons of soccer a statistician produced the following bivariate distribution of scores.a. What is the probability that the home team wins?b. What is the probability of a tie?c. What is the probability that the visiting team wins? Home team Visiting team 2 3 .11 .09 .10 .14
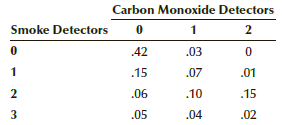
Refer to Exercise 7.59.In exercise 7.59A fire inspector has conducted an extensive analysis of the number of smoke detectors and the number of carbon monoxide detectors in the homes in a large city. The analysis led to the creation of the following bivariate probability distribution.a. Determine
Refer to Exercise 7.59.In exercise 7.59A fire inspector has conducted an extensive analysis of the number of smoke detectors and the number of carbon monoxide detectors in the homes in a large city. The analysis led to the creation of the following bivariate probability distribution.a. Determine
Refer to Exercise 7.59.In exercise 7.59A fire inspector has conducted an extensive analysis of the number of smoke detectors and the number of carbon monoxide detectors in the homes in a large city. The analysis led to the creation of the following bivariate probability distribution.a. What
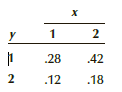
The bivariate distribution of X and Y is described here.a. Find the marginal probability distribution of X.b. Find the marginal probability distribution of Y .c. Compute the mean and variance of X.d. Compute the mean and variance of Y . х .28 .42 .12 .18 2.
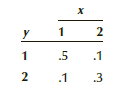
Refer to Exercise 7.45.In exercise 7.45The following table lists the bivariate distribution of X and Y .a. Determine the distribution of X + Y .b. Determine the mean and variance of X + Y .c. Does your answer to part (b) equal the answer to Exercise 7.45? х 2 .5 .1 .1 .3 2.
Refer to Exercise 7.45. Use the laws of expected value and variance of the sum of two variables to compute the mean and variance of X + Y .In exercise 7.45The following table lists the bivariate distribution of X and Y .a. Find the marginal probability distribution of X.b. Find the marginal
Should government do more or less to solve country’s problems (HELPNOT: 1 = Government should do more; 2, 3, 4, 5 = Government does too much)?
Has educational levels kept uniform over the years 2006, 2008, 2010, 2012, and 2014? Conduct a test to determine whether the number of years of education (EDUC) differs in the 8-year period.
Has the amount of television American adults watch been constant over the years 2006, 2008, 2010, 2012, and 2014 or has the amount varied. Test to determine whether the number of hours of television per day (TVHOURS) changed over the 8-year span.
How much evidence is there that more education leads to higher incomes and more financial success? Test to determine whether differences in income (INCOME) exist between the four education categories.
Does the education category affect the net worth of households? Is so, there should be differences in net worth between the four categories of education. Conduct a test to determine whether there are such differences (NETWORTH).
Are more educated individuals likely to have more unrealized capital gains? Is there enough evidence to infer that there are differences in total unrealized capital gains (KGTOTAL)?
Is education a factor in the amount of debt carried by heads of households? Conduct a statistical test to determine whether the amount of debt (DEBT) differs between the four categories.
Do households headed by a more educated person spend their food dollars differently from households headed by less-educated people? Is there enough evidence to conclude that there are differences in the annual expenditures on food at home between the four categories of education (FOOD HOME)?
Is there enough evidence to conclude that there are differences in total annual amount spent on food away from home between the four categories (FOODAWAY)?
Are some industries better than others in terms of financial remuneration? Conduct a test to determine whether there are differences in income (INCOME) between the three categories of industry.
Can we infer from the data that there are differences in net worth (NETWORTH) between the heads of households whose jobs are in one of the three industry classifications? 14.55 Can we infer from the data that there are differences in the amount of debt (DEBT) between the three industry
Can we infer from the data that there are differences in the total unrealized capital gains (KGTOTAL) between the three industry classifications?
Can we infer from the data that there are differences in the total unrealized capital gains (KGTOTAL) between the three industry classifications?
Refer to Exercise 14.23.a. Apply Tukey’s multiple comparison method to determine which pairs of means differ.b. Use the Bonferroni adjustment test to determine whether there are differences between each of the following pairs: PARTYID: 0 and 1, 0 and 2, 1 and 2.c. Use the Bonferroni adjustment
Refer to Exercise 14.24. Suppose that all you want to know is whether there are statistically significant differences in income between the three Independents (PARTYID: 2, 3, and 4). Perform the appropriate statistical procedure.In exercise 14.24Does income affect the way Americans choose which
Refer to Exercise 14.25.a. Apply Tukey’s multiple comparison method to determine whether any means differb. Is this result different from analysis of variance F-test?In exercise 14.25If differences in income exist, is it because higher-income Americans work harder? Can we conclude from the data
Refer to Exercise 14.26.a. Apply Tukey’s multiple comparison method to determine which pairs of means differ.b. Use the Bonferroni adjustment test to determine whether there are differences between each of the following pairs of Independents: PARTYID: 2 and 3, 2 and 4, 3 and 4.In exercise
Refer to Exercise 14.27.a. Use Tukey’s multiple comparison method to determine which pairs of political parties differ.b. Use an appropriate method the compare the three Independents with the other. That is, test for the following pairs of means PARTYID: 2 and 3, 2 and 4, and 3 and 4.In exercise
a. Apply the analysis of variance to determine whether there is enough evidence to conclude that there are differences in income (RINCOME) between the races (RACE: 1 = White, 2 = Black, 3 = Other). b. Use Tukey’s method to determine which means differ.
a. Use the analysis of variance to test for differences in the number of hours worked (HRS1) between races (RACE: 1 = White, 2 = Black, 3 = Other).b. Apply Tukey’s method to determine whether there are differences.c. Describe what you have discovered.
Is it a myth that Democrats are more educated than Republicans and Independents?a. Use the analysis of variance to determine whether the years of education (EDUC) differ among Democrats, Independents, and Republicans (PARTYID3: 1 = Democrat, 2 = Independent, 3 = Republican)b. Use Tukey’s multiple
Refer to Exercise 14.29. If you wanted to determine whether the following pairs of means differ: PARTYID: 1 and 3, 1 and 5, 3 and 5, which multiple comparison method would you select? What value of a would you use? Perform the test.In exercise 14.29With government-funded health insurance in the air
Refer to Exercise 14.30. Suppose that you want to determine whether there are differences in the amount of education between each pair of liberals: POLVIEWS: 1 = Extremely liberal, 2 = Liberal, 3 = Slightly liberal.a. Which procedure should you use?b. Use the technique and report the results.In
Refer to Exercise 14.31. Apply Tukey’s multiple comparison method to test for differences in income for each pair of political views.In exercise 14.31What happens to Americans’ political philosophies as they grow richer? If they change we would expect differences in income (RINCOME) between the
Refer to Exercise 14.39. Use Tukey’s multiple comparison method to determine which pairs differ.In exercise 14.39Television networks and their advertisers are constantly surveying viewers to determine their likes and dislikes and how much time adults spend watching television per day. Do the data
Refer to Exercise 14.34. Suppose that you want to determine which of the following pairs of means differ (POLVIEWS: 1 and 2, 1 and 3, 2 and 3).a. Which technique should you use?b. Use the technique and describe your results.In exercise 14.34Is there enough evidence to infer that there are
Refer to Exercise 14.51. Use Tukey’s multiple comparison method to determine which pairs of means differ.In exercise 14.51Do households headed by a more educated person spend their food dollars differently from households headed by less-educated people? Is there enough evidence to conclude that
Refer to Exercise 14.52. Apply Tukey’s method to determine whether there is enough statistical evidence to infer that each pair of means differ. Developing an Understanding of Statistical Concepts.In exercise 14.52Is there enough evidence to conclude that there are differences in total annual
Repeat Exercise 14.98 for the 2012 General Social Survey.In exercise 14.98Is there sufficient evidence to conclude that there are differences in the years of education between American adults and their fathers and mothers (EDUC, PAEDUC, MAEDUC)?
How have 25- to 34-year-olds with university degrees fared financially since 1984? To answer this question, the Pew Research Center conducted surveys in 1984, 1996, and 2009 recording monthly earnings for graduates with three different types of degrees. The incomes were converted into 2012
Refer to Exercise 14.129. A similar study was conducted for Bachelor’s degrees.a. Can we infer from the data that incomes differed for 25- to 34-year-olds with Bachelor’s degrees between the three periods?b. Are the required conditions satisfied? Explain.In exercise 14.129How have 25- to
Refer to Exercise 14.129. A similar study determined the monthly household income of households headed by 25- to 34-year-olds with only a high school diploma. The incomes were converted to 2012 dollars.a. Is there sufficient evidence to infer that household incomes differed for 25- to 34-year-olds
Does the day a house is listed for sale affect how long it takes for the sale to be completed or its selling price? A study conducted by economists attempted to answer the question. A random sample of houses that sold in a major city was studied. The number of days between the listing and the sale
Another useful measure of Americans’ beliefs about the state of the economy is the age at which they believe they will retire. If non retired people believe that they will need to work longer to be able to afford their lifestyle after retirement it likely means that their confidence in the
Each year Michigan State University’s Collegiate Employment Research Institute tracks starting salaries of graduates. The Institute recorded the starting salaries of the following engineers: chemical, civil, computer, electrical, and mechanical.a. Is there sufficient evidence to infer that
The U.S. Bureau of Labor Statistics conducts regular surveys to determine how Americans are spending their money. The annual expenditures for vehicle insurance of a random sample of American households in 2012, 2013, and 2014 were recorded. Is there sufficient evidence to infer that the
Refer to Exercise 14.135. Do Americans spend more on health care as they age? To answer the question, economists turned to the Bureau of Labor Statistics to measure how much Americans in the following age groups spend annually on health care. (1) 55–64 (2) 65–74 (3) 75 and older Random samples
St Catharine’s-Niagara, Kitchener- Cambridge-Waterloo. Brantford, Guelph, London, and Windsor are relatively small cities in Southwest Ontario. Because of their size the expectation is that the time it takes to get from home to work would not be large. To examine the issue a statistics
Automobile insurance companies use statistics to determine their premiums. The premiums are proportional to the risks and costs of accidents. Suppose that an economist conducted a study that looked at miles driven in the previous year, ages of the drivers, and their gender. The age categories are
The National Center for Charitable Statistics estimates that individual giving in the United States in 2014 was $258.51 billion. A study to determine who gave and how much they gave was undertaken. A random sample of individuals who gave to charities was drawn. For each respondent, the study
Do married couples typically have the same completed degrees? Conduct a test to determine whether there is enough evidence to conclude that married couples do not have the same degrees (DEGREE, SPDEG, Highest degree completed of respondent and spouse: 0 = Left high school, 1 = High school, 2 =
Conduct the Kruskal–Wallis test on the following statistics. Use a 5% significance level.T1 = 984 n1 = 23T2 = 1,502 n2 = 36T3 = 1,430 n3 = 29
From the following statistics, use the Kruskal–Wallis test (with α = .01) to determine whether the population locations differ.T1 = 1,207 n1 = 25T2 = 1,088 n2 = 25T3 = 1,310 n3 = 25T4 = 1,445 n4 = 25
Apply the Kruskal–Wallis test and the following statistics to determine whether there is enough statistical evidence at the 10% significance level to infer that the population locations differ.T1 = 3,741 n1 = 47T2 = 1,610 n2 = 29T3 = 4,945 n3 = 67
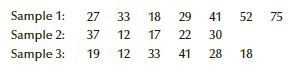
Use the Kruskal€“Wallis test on the following data to determine whether the population locations differ. (Use α = .05.) Sample 1: Sample 2: Sample 3: 18 33 12 41 22 52 27 29 75 37 19 17 33 12 30 41 28 18
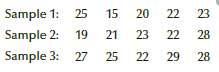
Using the Kruskal€“Wallis test, determine whether there is enough evidence provided by the accompanying data to enable us to infer that at least two population locations differ. (Use α = .05.) 23 Sample 1: 25 20 15 22 Sample 2: 19 21 22 23 28 Sample 3: 27 25 28 22 29
a. Four random samples of 50 people each were asked to rate four different computer printers in terms of their ease of use. The responses are:Very easy to useEasy to useDifficult to useVery difficult to useThe responses were coded using a 4-3-2-1 system.Do these data yield enough evidence at the 5%
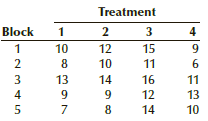
Apply the Friedman test to the accompanying table of data to determine whether we can conclude that at least two population locations differ. (Use α = .10.) Treatment Block 2 3 12 10 15 2 10 11 6. 3 13 14 16 11 4 9. 9. 12 13 14 10
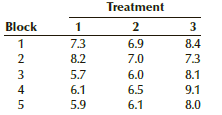
The following data were generated from a blocked experiment. Conduct a Friedman test to determine whether at least two population locations differ. (Use α = .05.) Treatment Block 2 3 7.3 6.9 8.4 2 8.2 7.0 7.3 3 5.7 6.0 8.1 4 6.1 6.5 9.1 5.9 6.1 8.0
a. A random sample of 30 people was asked to rate each of four different premium brands of coffee. The ratings are:ExcellentGoodFairPoorThe responses were assigned numbers 1 through 4, respectively. Can we infer that differences exist between the ratings of the four brands of coffee?b. Suppose that
a. Refer to Example 19.6. Suppose that the responses were recoded so that the numbers equaled the midpoint of the range of percentiles. That is: 97.5 = The candidate is in the top 5% of applicants92.5 = The candidate is in the top 10% of applicants, but not in the top 5%82.5 = The candidate is in
In an effort to determine whether differences exist between three methods of teaching statistics, a professor of business taught his course differently in each of three large sections. In the first section, he taught by lecturing; in the second, he taught by the case method; and in the third, he
Applicants to MBA programs must take the Graduate Management Admission Test (GMAT). There are several companies that offer assistance in preparing for the test. To determine whether they work, and if so, which one is best, an experiment was conducted.Several hundred MBA applicants were surveyed and
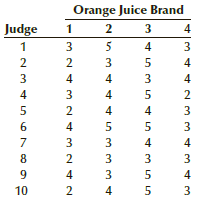
Ten judges were asked to test the quality of four different brands of orange juice. The judges assigned scores using a 5-point scale where 1 = Bad, 2 = Poor, 3 = Average, 4 = Good, and 5 = Excellent. The results are shown here. Can we conclude at the 5% significance level that there are differences
The manager of a chain of electronic products retailers is trying to decide on a location for its newest store. After a thorough analysis, the choice has been narrowed to three possibilities. An important factor in the decision is the number of people passing each location. The number of people
Many North Americans suffer from high levels of cholesterol, which can lead to heart attacks. For those with very high levels (over 280), doctors prescribe drugs to reduce cholesterol levels. A pharmaceutical company has recently developed three such drugs. To determine whether any differences
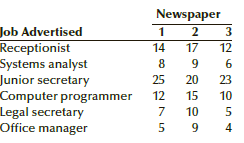
The manager of a personnel company is in the process of examining her company€™s advertising programs. Currently, the company advertises in each of the three local newspapers for a wide variety of positions, including computer programmers, secretaries, and receptionists. The manager has
A well-known soft-drink manufacturer has used the same secret recipe for its product since its introduction over 100 years ago. In response to a decreasing market share, however, the president of the company is contemplating changing the recipe. He has developed two alternative recipes. In a
The management of fast-food restaurants is extremely interested in knowing how their customers rate the quality of food and service and the cleanliness of the restaurants. Customers are given the opportunity to fill out customer comment cards. Suppose that one franchise wanted to compare how
A consumer testing service compared the effectiveness of four different brands of drain cleaner. The experiment consisted of using each product on 50 different clogged sinks and measuring the amount of time that elapsed until each drain became unclogged. The recorded times were measured in
During the last presidential campaign, the Gallup organization surveyed a random sample of 30 registered Democrats in January, another 30 in February, and yet another 30 in March. All 90 Democrats were asked to “rate the chances of the Democrats winning the presidential race in your state.” The
Showing 700 - 800
of 1191
1
2
3
4
5
6
7
8
9
10
11
12
Step by Step Answers