New Semester
Started
Get
50% OFF
Study Help!
--h --m --s
Claim Now
Question Answers
Textbooks
Find textbooks, questions and answers
Oops, something went wrong!
Change your search query and then try again
S
Books
FREE
Study Help
Expert Questions
Accounting
General Management
Mathematics
Finance
Organizational Behaviour
Law
Physics
Operating System
Management Leadership
Sociology
Programming
Marketing
Database
Computer Network
Economics
Textbooks Solutions
Accounting
Managerial Accounting
Management Leadership
Cost Accounting
Statistics
Business Law
Corporate Finance
Finance
Economics
Auditing
Tutors
Online Tutors
Find a Tutor
Hire a Tutor
Become a Tutor
AI Tutor
AI Study Planner
NEW
Sell Books
Search
Search
Sign In
Register
study help
mathematics
statistics for management
Statistics For Management And Economics 11th Edition Gerald Keller - Solutions
It is common practice in the advertising business to create several different advertisements and then ask a random sample of potential customers to rate the ads on several different dimensions. Suppose that an advertising firm developed four different ads for a new breakfast cereal and asked a
Do university students become more supportive of their varsity teams as they progress through their 4-year stint? To help answer this question, a sample of students was drawn. Each was asked their class standing (freshman, sophomore, junior, or senior) and to what extent they supported the
In anticipation of buying a new scanner, a student turned to a website that reported the results of surveys of users of the different scanners. A sample of 133 responses was listed showing the ease of use of five different brands. The survey responseswere:Very easyEasyNot easyDifficultVery
Do more educated people derive more satisfaction from their jobs? Test to determine whether there are differences in job satisfaction (SATJOB: 1 = Very satisfied, 2 = Moderately satisfied, 3 = A little dissatisfied, 4 = Very dissatisfied) between the degree holders (DEGREE: 0 = Left high school, 1
Respondents were asked the following question, Compared to your parents at your age is your standard of living (PARSOL: 1 = Much better, 2 = Somewhat better, 3 = About the same, 4 = Somewhat worse, 5 = Much worse)? Test to determine whether we can infer that differences in perception exist between
Are there differences between the five categories of marital status (MARITAL) with respect to health (HEALTH: 1 = Excellent, 2 = Good, 3 = Fair, 4 = Poor)? Conduct a statistical test to answer the question.
Do less-educated people believe that they have a higher probability of losing their job? Test to determine whether there is enough evidence to conclude that there are differences in perceived likelihood of losing their jobs ( JOBLOSE: 1 = Very likely, 2 = Fairly likely, 3 = Not too likely, 4 = Not
Is there enough statistical evidence to infer that there are differences between the three race categories (RACE) with respect to how likely they are to lose their jobs (JOBLOSE: 1 = Very likely, 2 = Fairly likely, 3 = Not too likely, 4 = Not likely)?
Is there enough statistical evidence to conclude that Democrats, Republicans, and Independents (PARTYID3: 1 = Democrat, 2 = Independent, 3 = Republican) differ in their views about the federal income tax that they have to pay (TAX: Do you consider the amount of federal income tax that you have to
Can we infer from the data that liberals, moderates, and conservatives (POLVIEWS3: 1 = Liberal, 2 = Moderate, 3 = Conservative) differ in their views about the federal income tax that they have to pay (TAX: Do you consider the amount of federal income tax that you have to pay as too high, about
Are there differences between the races with respect to their perceptions of their health (HEALTH: Would you say your own health, in general, is . . . 1. Excellent, 2. Good, 3. Fair, 4. Poor)? Use an appropriate statistical technique to determine whether there is enough evidence to infer that there
How does educational attainment affect newspaper readership? Is there enough evidence to conclude that there are differences between the five educational attainment groups (DEGREE: Highest degree completed of respondent, spouse, father, mother: 0 = Left high school, 1 = High school, 2 = Junior
Test the following hypotheses:H0: s = 0H1: s ≠ 0n = 50 rs = .23 α = .05
Is there sufficient evidence at the 5% significance level to infer that there is a positive relationship between two ordinal variables given that rs = .15 and n = 12?
A statistics student asked seven first-year economics students to report their grades in the required mathematics and economics courses. The results (where 1 = F, 2 = D, 3 = C, 4 = B, 5 = A) are as follows:Calculate the Spearman rank correlation coefficient, and test to determine whether we can
Does the number of commercials shown during a half-hour television program affect how viewers rate the show? In a preliminary study eight people were asked to watch a pilot for a situation comedy and rate the show (1 = Terrible, 2 = Bad, 3 = OK, 4 = Good, 5 = Very good). Each person was shown a
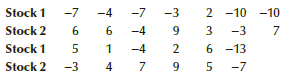
The weekly returns of two stocks for a 13-week period were recorded and are listed here. Assuming that the returns are not normally distributed, can we infer at the 5% significance level that the stock returns are correlated? -7 Stock 1 Stock 2 -3 9. 3 -4 2 -4 2 -10 -10 -3 -4 -7 6 Stock 1 Stock 2 .
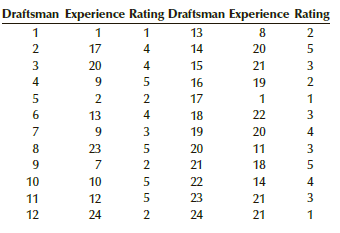
The general manager of an engineering firm wants to know whether a draftsman€™s experience influences the quality of his work. She selects 24 draftsmen at random and records their years of work experience and their quality rating (as assessed by their supervisors, where 5 = Excellent, 4 =
If the required condition is not satisfied conduct another more appropriate test to determine whether odometer reading and price are related.
At the completion of most courses in universities and colleges, a course evaluation is undertaken. Some professors believe that the way in which students fill out the evaluations is based on how well the student is doing in the course. To test this theory, a random sample of course evaluations was
Many people suffer from heartburn. It appears, however, that the problem may increase with age. A researcher for a pharmaceutical company wanted to determine whether age and the incidence and extent of heartburn are related. A random sample of 325 adults was drawn. Each person was asked to give his
Assume that the conditions for the test conducted in Exercise 16.6 are not met. Do the data allow us to conclude that the longer the commercial, the higher the memory test score will be?
Assume that the normality requirement in Exercise 16.7 is not met. Test to determine whether the price of a condominium and floor number are positively related.
Many people who quit smoking gain weight. Many explain that after they quit smoking food tastes better. To examine the relationship between smoking and taste, a researcher randomly sampled 280 smokers. Each was asked how many cigarettes they smoked on an average day. In addition, each person was
Gambling on sports is big business in the United States and Canada. A television executive wants to know whether the amount of money wagered on a professional football game affects the enjoyment of viewers. A random sample of 00 men who regularly watch football Sunday afternoons and wager on
Do older Americans have a greater fear of losing their jobs? Test to determine whether there is enough evidence to conclude that as one gets older (AGE) the probability of losing one’s job ( JOBLOSE: 1 = Very likely, 2 = Fairly likely, 3 = Not too likely, 4 = Not likely) decreases.
Do the most satisfying jobs also produce the highest income? Test to determine whether there is enough evidence to infer that more satisfying jobs (SATJOB: 1 = Very satisfied, 2 = Moderately satisfied, 3 = A little dissatisfied, 4 = Very dissatisfied) have higher incomes (RINCOME).
Is there sufficient evidence to infer that more educated (EDUC) people read newspapers more often (NEWS: 1 = Every day, 2 = A few times per week, 3 = Once a week, 4 = Less than once a week, 5 = Never)?
What is meant by chance variation?
What is meant by special variation?
Your education as a statistics practitioner can be considered a production process overseen by the course instructor. The variable we measure is the grade achieved by each student.a. Discuss chance variation—that is, describe the sources of variation that the instructor has no control over.b.
If the control limits of an x chart are set at 2.5 standard errors from the centerline, what is the probability that on any sample the control chart will indicate that the process is out of control when it is under control?
Refer to Exercise 21.5. What is the average run length until the x chart signals that the process is out of control when it is under control?In exercise 21.5If the control limits of an x chart are set at 2.5 standard errors from the centerline, what is the probability that on any sample the control
The control limits of an x chart are set at two standard errors from the centerline. Calculate the probability that on any sample the control chart will indicate that the process is out of control when it is under control.
Refer to Exercise 21.7. Determine the ARL until the x chart signals that the process is out of control when it is under control.In exercise 21.7The control limits of an x chart are set at two standard errors from the centerline. Calculate the probability that on any sample the control chart will
On average, how many units will be produced until the control chart signals that the process is out of control when it is under control?A production facility produces 100 units per hour and uses an x chart to monitor its quality. The control limits are set at 3 standard errors from the mean. When
Refer to Exercise 21.9.a. Find the probability that the x chart does not detect a shift of 1.5 standard deviations on the first sample after the shift occurs.b. Compute the probability that the x chart will not detect the shift for the first eight samples after the shift.In exercise 21.9On average,
Refer to Exercise 21.12.a. Find the probability that the x chart does not detect a shift of 1.5 standard deviations on the first sample after the shift occurs.b. Compute the probability that the x chart will not detect the shift for the first eight samples after the shift.In exercise 21.12The
Refer to Exercise 21.13. What is the average run length to detect the shift?A production facility produces 100 units per hour and uses an x chart to monitor its quality. The control limits are set at 3 standard errors from the mean. When the process goes out of control, it usually shifts the mean
Write a brief report comparing the sampling plans described in Exercises 21.9 and 21.12. Discuss the relative costs of the two plans and the frequency of Type I and Type II errors.A production facility produces 100 units per hour and uses an x chart to monitor its quality. The control limits are
Refer to Exercise 21.16.a. Find the probability that the x chart does not detect a shift of .75 standard deviation on the first sample after the shift occurs.b. Compute the probability that the x chart will not detect the shift for the first four samples after the shift.In exercise 21.16On average
Refer to Exercise 21.17. Find the average run length to detect the shift.A firm that manufactures notebook computers uses statistical process control to monitor all its production processes. For one component, the company draws samples of size 10 every 30 minutes. The company makes 4,000 of these
The company is considering changing the sampling plan so that 20 components are sampled every hour. What is the average number of units produced until the chart indicates that the process is out of control when it is not?A firm that manufactures notebook computers uses statistical process control
Refer to Exercise 21.19.a. Find the probability that the x chart does not detect a shift of .75 standard deviation on the first sample after the shift occurs.b. Compute the probability that the x chart will not detect the shift for the first four samples after the shift.In exercise 21.19The company
Refer to Exercise 21.20. What is the average run length to detect the shift?A firm that manufactures notebook computers uses statistical process control to monitor all its production processes. For one component, the company draws samples of size 10 every 30 minutes. The company makes 4,000 of
Write a brief report comparing the sampling plans described in Exercises 21.16 and 21.19. Discuss the relative costs of the two plans and the frequency of Type I and Type II errors.A production facility produces 100 units per hour and uses an x̅ chart to monitor its quality. The control limits are
Given the following statistics drawn from 30 samples of size 4, calculate the centerline and control limits for the x chart.x̅ = 453.6 S = 12.5
The mean of the sample means and the pooled standard deviation of 40 samples of size 9 taken from a production process under control are shown here. Compute the centerline, control limits, and zone boundaries for the x chart.x̅ = 181.1 S = 11.0
Refer to Exercise 16.46. Use a prediction interval with 90% confidence to predict the auction selling price of one Canada 1925 nickel with a grade of 40.Data from 16.46Refer to Exercise 3.70 where we looked at the relationship between the grade of a particular coin (Canadian 1925 nickel) and its
Refer to Exercise 16.45. Estimate with 95% confidence the mean time spent watching or reading news on the Internet for the population of people who have completed 12 years of education.In exercise 16.45Do more educated people spend more time watching or news on the Internet? To help answer the
Will the prediction interval always be wider than the estimation interval for the same value of the independent variable? Briefly explain.
Briefly describe the difference between predicting a value of y and estimating the expected value of y.
Repeat Exercise 16.74 for amount spent on food away from home (FOODAWAY).In exercise 16.74How much more do households have to spend on food when there are children living at home?a. Conduct a test to determine whether there is evidence of a positive linear relationship between total annual amount
How much more do households have to spend on food when there are children living at home?a. Conduct a test to determine whether there is evidence of a positive linear relationship between total annual amount spent on food at home (FOOD HOME) and number of children in the household (KIDS).b.
It takes many years to build up capital gains. Use a statistical analysis to determine whether there is enough evidence to conclude that as one grows older one increases unrealized capital gains (AGE, KGTOTAL). What is the p-value of the test?
Another way to interpret the results of Exercise 16.71 is that older people spend less on all food because their families are smaller (children have left home) or that they eat less expensive meals. If so, then we would expect that age (AGE) and amount spent on food at home FOOD HOME) are also
Are younger middle-class people more likely to eat out at restaurants than older people? Conduct a test to determine whether there is sufficient evidence to infer that age (AGE) and amount spent on food away from home (FOODAWAY) are negatively related?
It seems obvious that for people who take out student loans more years of education lead to larger student debt.a. Conduct a test to determine whether there is a positive linear relationship between years of education (EDUC) and total value of student loans (EDN_INST).b. Estimate the marginal
An increasing number of people are attending colleges and universities. The effect of this trend is that younger people will be more educated than older people. Conduct a test to determine whether age (AGE) and years of education (EDUC) are negatively linearly related among the heads of
Do you need more years of education to get further into debt? This question can be answered by determining the relationship between number of years of education (EDUC) and household debt (DEBT). Undertake a regression analysis to determine the following.a. Is there sufficient evidence to infer a
How does education (EDUC) affect financial success among the heads of middle class households? Conduct a regression analysis and determine the following.a. Is there evidence of a positive linear relationship between education and total financial assets (FIN)?b. Estimate with 95% confidence the
We who educate would like to believe that people who have more education are more likely to do well professionally and financially. Fortunately, we have a number of surveys with real data to confirm our beliefs. Analyze the relationship between years of education (EDUC) of the head of middle-class
Refer to Exercise 3.71 wherein we looked at the relationship between temperature and distance that golf balls travel.a. Conduct a regression analysis to determine whether there is enough evidence of a positive linear relationship.b. Interpret the slope coefficient.
National news on television features commercials describing pharmaceutical drugs that treat ailments that plague older people. Apparently, the major networks believe that older people tend to watch national newscasts. The marketing manager of a drug company conducted a survey that took a random
Refer to Exercise 3.70 where we looked at the relationship between the grade of a particular coin (Canadian 1925 nickel) and its auction selling price.a. Is there sufficient evidence to conclude that the two variables are linearly related?b. Compute the coefficient of determination and briefly
Assuming that the required conditions are satisfied in Exercise 16.13, what does this tell you about the distribution of used boat prices?Use a 5% significance level for all tests of hypotheses.
What are the required conditions for Exercise 16.8? Do these seem reasonable?
Describe what the required conditions mean in Exercise 16.6. If the conditions are satisfied, what can you say about the distribution of memory test scores?
Immigration has become a hot-button issue in American politics. One question that arises is: Are immigrants’ educational attainments different from those born in the United States? Conduct a test to answer the question (BORN: 1 = U.S., 2 = outside U.S.; DEGREE: Highest degree completed of
A critical issue for service companies is how many customers cancel. Some wireless carriers lose an average of 3% of their subscribers each month. Should companies spend more effort getting new customers or trying to win back old customers who left? Researchers have argued that it is easier and
A Gallup survey asked a random sample of federal government and private sector workers to judge their well-being. The responses are 1 = thriving, 2 = struggling, 3 = suffering. Is there enough evidence to conclude that government and private sector workers differ in their well-being?
Refer to Exercise 15.45. Random samples from Denmark, Ireland, the Netherlands, and Sweden were drawn. Is the sufficient evidence to infer that there are differences in household types between the four countries?In exercise 15.45To determine the actual side effects, pharmaceutical companies often
To determine the actual side effects, pharmaceutical companies often conduct studies that compare the side effects of their drug versus the side effects of a placebo. One such study examined the side effects of a new cold remedy. A random sample of 250 people was given the cold remedy and another
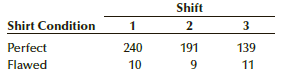
The operations manager of a company that manufactures shirts wants to determine whether there are differences in the quality of workmanship among the three daily shifts. She randomly selects 600 recently made shirts and carefully inspects them. Each shirt is classified as either perfect or flawed,
Can we infer that the Survey of Consumer Finances in 2013 overrepresented at least one education category (EDCL)? Developing an Understanding of Statistical Concepts.
Can we infer that the General Social Survey in 2014 over represented at least one category of marital status (MARITAL)?
Using the data supplied by NOAA National Weather Service, 19,450 tornadoes struck the United States between 2000 and 2014. The percentage for each month is listed here.January................................ 2.4%February.............................. 3.0%March...................................
From January 1 to December 31, 2011, there were 5,086 bank robberies in the United States. The percentage of that total for each day of the week is listed next. The number of robberies per day for the first two months of 2016 was recorded. Can we infer that the distribution of bank robberies per
An aging pitcher has recorded the following pitch distribution over his long career from 1995 to 2014.1. Fast ball..................... 52%2. Curve ball.................. 19%3. Slider......................... 15%4. Change up................. 14%However, undergoing a surgery to repair a tendon in
Refer to Exercise 15.15. After an entire season of pitches the following proportions for all pitches were observed.1. Pitch in the strike zone.................................................. 40.0%2. Pitch misses strike zone upper left.............................. 14.4%3. Pitch misses the strike
Pitch trackers allow baseball fans watching televised games to see whether an umpire made the correct call. After tracking all pitches over an entire season the following probabilities were recorded.1. Pitch was in the strike zone and the umpire called a ball
Review the results of Exercises 15.1–15.3. What is the effect of decreasing the sample size?
Americans work longer hours than residents of most other countries. Does this mean that American-born workers work more than do immigrants?a. Conduct a statistical test to determine whether American-born workers (BORN: 1 = In the United States, 2 = Elsewhere) work longer hours than immigrants
Who watches more television (TVHOURS), Democrats or Republicans (PARTYID3: 1 = Democrat; 3 = Republican)? Conduct a test to determine whether Democrats beat Republicans in this category.
Do Americans become more Conservative as they grow older? If this is true we would expect that Conservatives would be older than Liberals (POLVIEWS3: 1 = Liberal, 3 =Conservative).a. Test to determine whether there is enough evidence to conclude that Conservatives are older than liberals (AGE).b.
Estimate with 95% confidence the change in the percentage of Americans who were working for themselves (WRKSLF: 1 = Selfemployed)) between 2012 and 2014.
The perception among many voters is that public servants don’t work very hard.a. Is there enough evidence to draw the conclusion that public sector employees (WRKGOVT: 1 = Government, 2 = Private) work fewer hours than do their counterparts in the private sector (HRS1)?b. Are the required
If government workers (WRKGOVT: 1 = Government, 2 = Private) have more education it follows that they begin their careers later than do private sector employees. Does this mean that government workers are older (AGE)?a. Conduct a test to answer the question.b. Are the required conditions
One of the advantages of working for someone else is that the number of hours of work per week is limited as opposed to the number of hours for self-employed people.a. Is there sufficient evidence to infer that self employed individuals (WRKSLF: 1 = Selfemployed, 2 = Someone else) work longer hours
Another way of measuring an aging society is to compute the number of children per family. Is there enough evidence to infer that the number of children per family has decreased in the decade 2004–2014 (CHILDS)?
Innovation may be the key to creating high-value jobs. And innovation depends on education. Is there sufficient evidence to infer that the United States in 2014 is more educated than it was in 2004? Are the required conditions satisfied?
Are workers in 2014 working less than they did in 2004 (HRS1)? Test to determine whether there is enough evidence to answer the question affirmatively.
Is there sufficient evidence to infer that self-employed heads of households (OCCAT1: 1 = someone else, 2 = self-employed/partnership) have less net worth than heads of household who work for someone else (NETWORTH)?
Which political party is more educated? Conduct a test to determine whether differences in education (EDUC) actually exist among some of the eight political categories.
According to the Bureau of Labor Statistics, the average American family spent $2625 on food at restaurants. Is there enough evidence that wealthy households spend more than twice that figure (FOODAWAY)?
Refer to Exercise 13.5.a. Confirm that in each case the number of degrees of freedom for the equal-variances test statistic and confidence interval estimator is larger than that for the unequal-variances test statistic and confidence interval estimator.b. Try various combinations of sample sizes
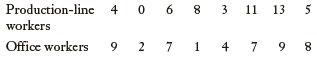
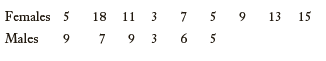
A human resources manager for a car company wanted to know whether production-line workers have more days absent than office workers. He took a random sample of eight workers from each category and recorded the number of days absent the previous year. Can we infer that there is a difference in days
The owner of a small book-publishing company is concerned about the declining number of people who read books. To learn more about the problem she takes a random sample of customers in a retail book store and asked each how many books they read in the last 12 months. The following figures were
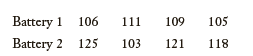
The operations manager of a manufacturer of television remote controls wants to determine which batteries last the longest in his product. He took a random sample of his remote controls and tested two brands of batteries. Here are the number of minutes of continuous use before the batteries failed
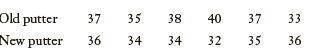
An avid golfer has just purchased a new putter with a money-back guarantee. She plays seven rounds with the new putter and seven rounds with her old putter and records the number of putts. Can the golfer conclude that the new putter is better? Old putter New putter 37 35 38 40 37 33 36 34 32 34 35
Showing 800 - 900
of 1191
1
2
3
4
5
6
7
8
9
10
11
12
Step by Step Answers