New Semester
Started
Get
50% OFF
Study Help!
--h --m --s
Claim Now
Question Answers
Textbooks
Find textbooks, questions and answers
Oops, something went wrong!
Change your search query and then try again
S
Books
FREE
Study Help
Expert Questions
Accounting
General Management
Mathematics
Finance
Organizational Behaviour
Law
Physics
Operating System
Management Leadership
Sociology
Programming
Marketing
Database
Computer Network
Economics
Textbooks Solutions
Accounting
Managerial Accounting
Management Leadership
Cost Accounting
Statistics
Business Law
Corporate Finance
Finance
Economics
Auditing
Tutors
Online Tutors
Find a Tutor
Hire a Tutor
Become a Tutor
AI Tutor
AI Study Planner
NEW
Sell Books
Search
Search
Sign In
Register
study help
mathematics
statistics for management
Statistics For Management And Economics 11th Edition Gerald Keller - Solutions
Can we conclude from the data that more educated (EDUC) people are more likely to perceive themselves as healthier (HEALTH: 1 = Excellent, 2 = Good, 3 = Fair, 4 = Poor)?
Are more educated people (EDUC) more likely to believe that that compared to their parents at their age their standard of living is better (PARSOL: 1 = Much better, 2 = Somewhat better, 3 = About the same, 4 = Somewhat worse, 5 = Much worse)? Perform an appropriate test to answer the question.
Is it a myth that younger Americans do not read newspapers, choosing instead to get their news from the Internet or television (or not at all)? Conduct a test to determine whether there is sufficient statistical evidence to conclude that younger people (AGE) read newspapers (NEWS: 1 = Every day, 2
If one works longer hours (HRS1) does the chances of losing one’s job (JOBLOSE: 1 = Very likely, 2 = Fairly likely, 3 = Not too likely, 4 = Not likely) become less likely? Conduct a test to answer the question.
Does age (AGE) affect one’s belief concerning the federal income tax that one has to pay (TAX: Do you consider the amount of federal income tax that you have to pay as too high, about right, or too low: 1 = Too high, 2 = About right, 3 = Too low)?
Are richer people healthier? Conduct a test to determine whether there is enough evidence to infer that higher income (RINCOME) individuals are healthier (HEALTH: Would you say your own health, in general, is . . . 1. Excellent, 2. Good, 3. Fair, 4. Poor)?
Are richer (RINCOME) Americans pessimistic about their children’s chances of having a higher standard of living (KIDSSOL: When your children are at yourage will their standard of living be. . . 1. Much better, 2. Somewhat better, 3. About the same, 4. Somewhat worse, 5. Much worse)? Conduct
Are education and income related? To answer this question, a random sample of people was selected and each was asked to indicate into which of the following categories of education they belonged:1. Less than high school2. High school graduate3. Some college or university but no degree4. University
In a study to determine which of two teaching methods is perceived to be better, two sections of an introductory marketing course were taught in different ways by the same professor. At the course’s completion, each student rated the course on a boring/stimulating spectrum, with 1 = Very boring,
The researchers at a large carpet manufacturer have been experimenting with anew dyeing process in hopes of reducing the streakiness that frequently occurs with the current process. As an experiment, 15 carpets are dyed using the new process, and another 15 are dyed using the existing method. Each
Large potential profits for pharmaceutical companies exist in the area of hair growth drugs. The head chemist for a large pharmaceutical company is conducting experiments to determine which of two new drugs is more effective in growing hair among balding men. One experiment was conducted as
Suppose that a precise measuring device for new hair growth has been developed and is used in the experiment described in Exercise 19.122. The percentages of new hair growth for the 30 pairs of men involved in the experiment were recorded. Do these data allow the chemist to conclude that drug B is
The printing department of a publishing company wants to determine whether there are differences in durability between three types of book bindings. Twenty-five books with each type of binding were selected and placed in machines that continually opened and closed them. The numbers of openings and
In recent years, consumers have become more safety conscious, particularly about children’s products. A manufacturer of children’s pajamas is looking for material that is as nonflammable as possible. In an experiment to compare a new fabric with the kind now being used, 50 pieces of each kind
Samuel’s is a chain of family restaurants. Like many other service companies, Samuel’s surveys its customers on a regular basis to monitor their opinions. Two questions (among others) asked in the survey are as follows:a. While you were at Samuel’s, did you find the service Slow (1), Moderate
An advertising firm wants to determine the relative effectiveness of two recently produced commercials for a car dealership. An important attribute of such commercials is their believability. To judge this aspect of the commercials, 60 people were randomly selected. Each watched both commercials
Researchers at the U.S. National Institute of Aging in Bethesda, Maryland, have been studying hearing loss. They have hypothesized that as men age they will lose their hearing faster than comparably aged women because many more men than women have worked at jobs where noise levels have been
In a Gallup poll this year, 200 people were asked, “Do you feel that the newspaper you read most does a good job of presenting the news?” The same question was asked of another 200 people 10 years ago. The possible responses were as follows:3 = Good job2 = Fair job1 = Not a good jobDo these
It is common practice in many MBA programs to require applicants to arrange for a letter of reference. Some universities have their own forms in which referees assess the applicant using the following categories:5: The candidate is in the top 5% of applicants.4: The candidate is in the top 10% of
The increasing number of traveling businesswomen represents a large potential clientele for the hotel industry. Many hotel chains have made changes designed to attract more women. To help direct these changes, a hotel chain commissioned a study to determine whether major differences exist between
To examine the effect that a tough midterm test has on student evaluations of professors, a statistics professor had her class evaluate her teaching effectiveness before the midterm test. The questionnaire asked for opinions on a number of dimensions, but the last question is considered the most
The town of Stratford, Ontario, is very much dependent on the Shakespearean Festival it holds every summer for its financial well-being. Thousands of people visit Stratford to attend one or more Shakespearean plays and spend money in hotels, restaurants, and gift shops. As a consequence, any sign
Scientists have been studying the effects of lead in children’s blood, bones, and tissue for a number of years. It is known that lead reduces intelligence and can cause a variety of other problems. A study directed by Dr. Herman Needleman, a psychiatrist at the University of Pittsburgh Medical
How does gender affect teaching evaluations? Several researchers addressed this question during the past decade. In one study several female and male professors in the same department with similar backgrounds were selected. A random sample of 100 female students was drawn. Each student evaluated a
It is an unfortunate fact of life that the characteristics that one is born with play a critical role in later life. For example, race is a critical factor in almost all aspects of North American life. Height and weight also determine how friends, teachers, employers, and customers will treat you.
According to a CNN news report 9% of full-time workers telecommute. This means that they do not work in their employers’ offices but instead perform their work at home using a computer and modem. To ascertain whether such workers are more satisfied than their non telecommuting counterparts, a
How does alcohol affect judgment? To provide some insight, an experiment was conducted. A random sample of customers of an Ohio club was selected. Each respondent was asked to assess the attractiveness of members of the opposite sex who were in the club at the time. The assessment was to be made on
Can you become addicted to exercise? In a study conducted at the University of Wisconsin at Madison, a random sample of dedicated exercisers who usually work out every day was drawn. Each completed a questionnaire that gauged their mood on a 5-point scale (where 5 = Very relaxed and happy, 4 =
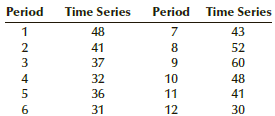
For the following time series, compute the three-period moving averages. Time Series Period Period Time Series 48 43 2 52 3 37 60 4 32 10 48 36 11 41 31 12 30
Compute the five-period moving averages for the time series in Exercise 20.1.In exercise 20.1For the following time series, compute the three-period moving averages. Time Series Period Period Time Series 48 43 2 52 3 37 60 4 32 10 48 36 11 41 31 12 30
For Exercises 20.1 and 20.2, graph the time series and the two moving averages.
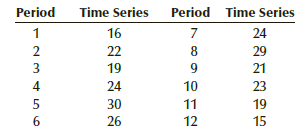
For the following time series, compute the three-period moving averages. Period Time Series Period Time Series 16 24 29 2 22 3 19 21 4 24 10 23 19 26 12 15
For Exercise 20.4, compute the five-period moving averages.In exercise 20.4For the following time series, compute the three-period moving averages. Period Time Series Period Time Series 16 24 29 2 22 3 19 21 4 24 10 23 19 26 12 15
For Exercises 20.4 and 20.5, graph the time series and the two moving averages.
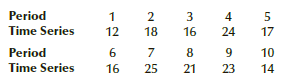
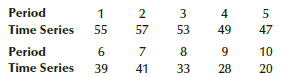
Apply exponential smoothing with w = .1 to help detect the components of the following time series. Period Time Series 3 18 16 12 17 24 Period 6 10 14 Time Series 25 23 16 21
Repeat Exercise 20.7 with w = .8.In exercise 20.7Apply exponential smoothing with w = .1 to help detect the components of the following time series. Period Time Series 3 18 16 12 17 24 Period 6 10 14 Time Series 25 23 16 21
For Exercises 20.7 and 20.8, draw the time series and the two sets of exponentially smoothed values. Does there appear to be a trend component in the time series?
Apply exponential smoothing with w = .1 to help detect the components of the following time series. Period 4 5 45 2 43 3 42 Time Series 46 38 3. 9. 10 Period Time Series 48 50 49 46 45
Repeat Exercise 20.10 with w = .8.In exercise 20.10Apply exponential smoothing with w = .1 to help detect the components of the following time series. Period 4 5 45 2 43 3 42 Time Series 46 38 3. 9. 10 Period Time Series 48 50 49 46 45
For Exercises 20.10 and 20.11, draw the time series and the two sets of exponentially smoothed values. Does there appear to be a trend component in the time series?
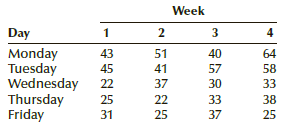
The following daily sales figures have been recorded in a medium-size merchandising firm.a. Compute the three-day moving averages.b. Plot the time series and the moving averages on a graph.c. Does there appear to be a seasonal (weekly) pattern? Week Day 3 Monday Tuesday Wednesday Thursday Friday 43
For Exercise 20.13, compute the five-day moving averages, and superimpose these on the same graph. Does this help you answer part (c) of Exercise 20.13?In exercise 20.13The following daily sales figures have been recorded in a medium-size merchandising firm.a. Compute the three-day moving
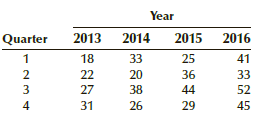
The following quarterly sales of a department store chain were recorded for the years 2013€“2016.a. Calculate the four-quarter centered moving averages.b. Graph the time series and the moving averages.c. What can you conclude from your time-series smoothing? Year 2014 2013 2015 2016
Repeat Exercise 20.15, using exponential smoothing with w = .4.In exercise 20.15The following quarterly sales of a department store chain were recorded for the years 2013€“2016.a. Calculate the four-quarter centered moving averages.b. Graph the time series and the moving averages. Year
Repeat Exercise 20.15, using exponential smoothing with w = .8.In exercise 20.15The following quarterly sales of a department store chain were recorded for the years 2013€“2016.a. Calculate the four-quarter centered moving averages.b. Graph the time series and the moving averages. Year
Plot the following time series. Would the linear or quadratic model fit better? 1 2 3 4 5 6 7 Period Time Series 5 2.7 4.1 10.8 19.2 6.9 .6 1.3
Plot the following time series to determine which of the trend models appears to fit better. Period Time Series Period Time Series 3 49 47 53 57 55 8 10 41 39 28 33 20 4. 2.
Refer to Exercise 20.18. Use regression analysis to calculate the linear and quadratic trends. Which line fits better?In exercise 20.18Plot the following time series. Would the linear or quadratic model fit better? 1 2 3 4 5 6 7 Period Time Series 5 2.7 4.1 10.8 19.2 6.9 .6 1.3
Refer to Exercise 20.19. Use regression analysis to calculate the linear and quadratic trends. Which line fits better?In exercise 20.19Plot the following time series to determine which of the trend models appears to fit better. Period Time Series Period Time Series 3 49 47 53 57 55 8 10 41 39 28 33
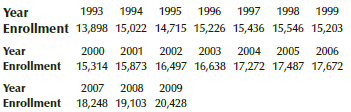
College and university enrollment increased sharply during the 1970s and 1980s. However, since then, the rate of growth has slowed. To help forecast future enrollments, an economist recorded the total U.S. college and university enrollment from 1993 to 2009. These data (in thousands) are listed
Foreign trade is important to the United States. No country exports and imports more. However, there has been a large trade imbalance in many sectors. To measure the extent of the problem, an economist recorded the difference between exports and imports of merchandise (excluding military) for the
The number of cable television subscribers has increased over the past 5 years. The marketing manager for a cable company has recorded the numbers of subscribers for the past 24 quarters.a. Plot the numbers.b. Compute the seasonal (quarterly) indexes.
The owner of a pizzeria wants to forecast the number of pizzas she will sell each day. She recorded the numbers sold daily for the past 4 weeks. Calculate the seasonal (daily) indexes.
A manufacturer of ski equipment is in the process of reviewing his accounts receivable. He noticed that there appears to be a seasonal pattern with the accounts receivable increasing in the winter months and decreasing during the summer. The quarterly accounts receivable (in$millions) were
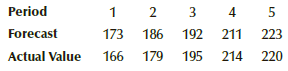
For the actual and forecast values of a time series shown here, calculate MAD and SSE. Period 3 186 192 5 2 173 4 Forecast 211 223 Actual Value 166 195 179 214 220
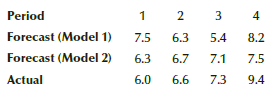
Two forecasting models were used to predict the future values of a time series. These are shown here together with the actual values. Compute MAD and SSE for each model to determine which was more accurate. Period Forecast (Model 1) Forecast (Model 2) 4 2 3 7.5 6.3 8.2 5.4 6.3 6.7 7.1 7.5 Actual
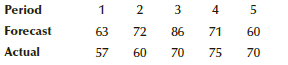
Calculate MAD and SSE for the forecasts that follow. Period 4 2 3 Forecast 63 72 86 71 60 Actual 70 57 60 75 70 2.
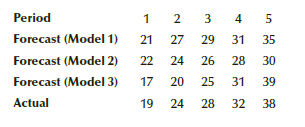
Three forecasting techniques were used to predict the values of a time series. These values are given in the following table. Compute MAD and SSE for each technique to determine which was most accurate. Period 2 3 Forecast (Model 1) 21 27 29 31 35 Forecast (Model 2) 22 24 26 28 30 20 Forecast
A new credit card company is investigating various market segments to determine whether it is profitable to direct its advertising specifically at each one. One of the market segments is composed of Hispanic people. According to the United States census, there are 41,580,000 Hispanic adults (18 and
A California university is investigating expanding its evening programs. It wants to target people between 25 and 55 years old who have completed high school but did not complete college or university. To help determine the extent and type of offerings, the university needs to know the size of its
The JC Penney department store chain segments the market for women’s apparel by its identification of values. The three segments are:1. Conservative2. Traditional3. ContemporaryQuestionnaires about personal and family values are used to identify which segment a woman falls into. Suppose that the
Most life insurance companies are leery about offering policies to people over 64. When they do the premiums must be high enough to overcome the predicted length of life. The president of one life insurance company was thinking about offering special discounts to Americans over 64 who held
An advertising company was awarded the contract to design advertising for Rolls Royce automobiles. An executive in the firm decided to pitch the product not only to the affluent in the United States but also to those who think they are in the top 1% of income earners in the country. A survey was
According to FBI statistics, there were 354,520 robberies in the United States in 2012 (latest statistics available). A random sample of robberies was drawn and the amount of loss was recorded. Estimate with 95% confidence the total loss of all the robberies in the United States in 2012.
In 2016, the average household debt service ratio for homeowners was 10.02. The household debt service ratio is the ratio of debt payments to disposable personal income. Debt payments consist of mortgage payments and payments on consumer debts. To determine whether this economic measure has
Refer to Exercise 12.164. Another measure of indebtedness is the financial obligations ratio, which adds automobile lease payments, rental on tenant occupied property,homeowners insurance, and property tax payments to the debt service ratio. In 2016, the ratio for homeowners was 15.31. Can we
Refer to Exercise 12.165. In 2006 the financial obligations ratio for renters was 23.65. Can we infer that financial obligations ratio for renters has increased between 2016 and this year?In exercise 12.165Refer to Exercise 12.164. Another measure of indebtedness is the financial obligations ratio,
In 2015, there were 124,587,000 (Source: United States Census) households in the United States. There were 81,716,000 family households made up of married couples, single male, and single female households. To determine how many of each type a survey was undertaken. The results were stored using
Wages and salaries make up only part of a total compensation. Other parts include paid leave, health insurance, and many others. In 2013, wages and salaries among manufacturers in the United States made up an average of 65.8% of total compensation. To determine if this changed, a random sample of
Several decades ago a large proportion of Americans smoked cigarettes. However, in recent years many adults have quit. To measure the extent of current smoking a random sample of American adults was asked to report whether they smoked (1 = yes, 2 = no). There are 244,137,873 American adults.
It has been said that America is a nation of immigrants. Estimate with 95% confidence the number of Americans 18 and over who were born outside the United States (BORN: 2 = Born outside the United States).
How many people work for the federal, state, or local government? adults (18 and over) who work for the federal, state, or local government (WRKGOVT: 1 = Government).
Is the entrepreneurial spirit of the United States alive and well? Estimate with 95% confidence the number of Americans who work for themselves (WRKSLF: 1 = Self-employed).
How much television are Americans watching? Because of all the other forms of electronic amusement Americans may be watching less television. A marketing specialist believes that Americans are watching less than 3 hours per day (TVHOURS). Conduct a test to determine whether there is enough evidence
In the 2010 census, the proportion of Black/African Americans was 12.9%. Has that percentage decreased? Conduct a test using the Survey of Consumer Finances of 2013 to answer the question (RACE: 2 = Black/African American).
According to the 2010 census, among people who were never married the percentage who did not finish high school was 14.0%. Has the proportion in 2014 increased? Perform a statistical test to answer the question (MARITAL: 5 = Never married; DEGREE: 0 = Left high school).
An increasing number of women are attending university. Women now outnumber men in most college programs. In the 2010 census, the proportion of women with graduate degrees was 10.2% (The census used “advanced” to represent graduate degrees.) Can we infer from the General Social Survey of 2014
In the 2010 census, the proportion of divorced White Americans was 10.4%. Has that percentage in 2014 increased? Conduct a statistical test to answer the question (RACE: 1 = White; MARITAL: 3 = Divorced).
Since 2010 the number of jobs available for people who have not completed high school has decreased. Has this resulted in a change in the proportion of Americans who did not complete high school? Perform a statistical test to answer the question (DEGREE: 0 = Left high school).
In 2010, the United States was just recovering from the housing debacle. The percentage of home ownership was 65.8%. Is there enough evidence to infer that the proportion of home ownership has changed since then (DWELOWN: 1 = Own)?
Has the proportion of Americans who were never married changed since the census? Conduct a test to answer the question (MARITAL: 5 = Never married).
Is there sufficient evidence to infer that the proportion of White Americans has decreased since the 2010 census (RACE: 1 = White)?
Refer to the chapter-opening example. Estimate with 95% confidence the number of Americans 18 to 49 years old who were tuned to the American Idol.
There are a variety of ways in which households have debt. The largest is probably the mortgage on the home they live in. Others include student debt, vehicle loans, and credit card debt.a. To determine how much debt is carried by middle- class American families estimate the mean debt (DEBT).b. Is
How much money do middle- class Americans keep in their checking account (CHECKING)?a. Estimate the mean amount held in checking accounts.b. What is the required condition?c. Is it satisfied?
Because to be in the middle class requires a net worth of at least $67,300, we would expect the average age (AGE) of middle-class American adults to be greater than the average age of all American adults, which is 50.4.a. Conduct a test to determine whether there is enough evidence to support this
While conducting a test to determine whether a population mean is less than 900, you find that the sample mean is 1,050.a. Can you make a decision on this information alone? Explain.b. If you did calculate the p-value, would it be smaller or larger than .5? Explain.
You are conducting a test to determine whether there is enough statistical evidence to infer that a population mean is greater than 100. You discover that the sample mean is 95.a. Is it necessary to do any further calculations? Explain.b. If you did calculate the p-value would it be smaller or
Research objective: The population mean is not equal to –5.σ = 5, n = 25, x̅ = − 4.0
Research objective: The population mean is not equal to 0.σ = 50, n = 90, x̅ = − 5.5.
Research objective: The population mean is less than 0.σ = 25, n = 400, x̅ = − 2.3
Research objective: The population mean is greater than 0.σ = 10, n = 100, x̅ = 1.5
a. Amazon (AMZN): 25%, Apple (AAPL): 25%, Bed Bath and Beyond (BBBY): 25%, Dollar Tree (DLTR): 25%b. AMZN: 10%, AAPL: 40%, BBBY: 10%, DLTR: 40%c. AMZN: 40%, AAPL: 30%, BBBY: 20%, DLTR: 10%d. Which portfolio would a gambler choose? Explain.e. Which portfolio would a risk-averse investor choose?
a. Costco (COST): 25%, Dollar Tree (DLTR): 25%, Expedia (EXPE): 25%, ScanDisk (SNDK): 25%b. COST: 10%, DLTR: 20%, EXPE: 30%, SNDK: 40%c. COST: 10%, DLTR: 10%, EXPE: 70%, SNDK: 10%d. Which portfolio would a gambler choose? Explain.e. Which portfolio would a risk-averse investor choose? Explain.
a. Intel (INTC): 25%, Oracle (ORCL): 25%, Sirius (SIRI): 25%, Starbucks (SBUX): 25%b. INTC: 10%, ORCL: 10%, SIRI: 10%, SBUX: 70%c. INTC: 40%, ORCL: 30%, SIRI: 20%, SBUX: 10%d. Which portfolio would a gambler choose? Explain.e. Which portfolio would a risk-averse investor choose? Explain.
Repeat Exercise 7.100 using Excel.In exercise 7.100Given a binomial random variable with n = 10 and p = .3, use the formula to find the following probabilities.a. P(X = 3)b. P(X = 5)c. P(X = 8)
Repeat Exercise 7.103 using Excel.In exercise 7.103Given a binomial random variable with n = 6 and p = .2, use the formula to find the following probabilities.a. P(X = 2)b. P(X = 3)c. P(X = 5)
Repeat Exercise 7.106 using Excel.In exercise 7.106Suppose X is a binomial random variable with n = 25 and p = .7. Use Table 1 to find the following.a. P(X = 18)b. P(X = 15)c. P(X ≤ 20)d. P(X ≥ 16)
In a recent Gallup poll 53% of American adults believed that Congress is doing a poor or bad job. Suppose that you randomly choose 100 American adults and ask their opinion about Congress.a. Determine the probability that more than half say that Congress is doing a poor or bad job.b. Compute the
At an auction of antique furniture a statistician kept track of the number of bids for each item. After an analysis of the figures she concludes that the number of bids is Poisson distributed with a mean of 2.5.a. Calculate the probability that on any item the number of bids is 5 or more.b. Compute
Showing 600 - 700
of 1191
1
2
3
4
5
6
7
8
9
10
11
12
Step by Step Answers