New Semester
Started
Get
50% OFF
Study Help!
--h --m --s
Claim Now
Question Answers
Textbooks
Find textbooks, questions and answers
Oops, something went wrong!
Change your search query and then try again
S
Books
FREE
Study Help
Expert Questions
Accounting
General Management
Mathematics
Finance
Organizational Behaviour
Law
Physics
Operating System
Management Leadership
Sociology
Programming
Marketing
Database
Computer Network
Economics
Textbooks Solutions
Accounting
Managerial Accounting
Management Leadership
Cost Accounting
Statistics
Business Law
Corporate Finance
Finance
Economics
Auditing
Tutors
Online Tutors
Find a Tutor
Hire a Tutor
Become a Tutor
AI Tutor
AI Study Planner
NEW
Sell Books
Search
Search
Sign In
Register
study help
mathematics
statistics for management
Statistics For Management And Economics 11th Edition Gerald Keller - Solutions
In a Reason-Rupe poll, a random sample of people were asked, “Just a rough guess, what percent profit on each dollar of sales do you think the average company makes after taxes?” The results from 5 years ago and this year were recorded. Can we infer that the guesses this year are higher than
Is there a tax on the poor? The tax on income is progressive in that higher income individuals pay at a high rate than lower-income people. For example, the top 0.1 percent of taxpayers earn 9.1 percent of the income, but pay 17.4 percent of all federal taxes. The top 1 percent of taxpayers earn 19
Study after study indicate that men earn higher incomes than women (SEX: 1 = Male, 2 = Female).a. To determine the extent of the differential in 2014 estimate the difference between male and female annual incomes (RINCOME).b. What are the required conditions for the validity of your answer in part
Immigration has become an important topic in American politics. Some immigrants came o the United States to do jobs that Americans do not want to do. Many of these immigrants have little formal education. Other immigrants came to the United States with work permits. Many of these are highly
Because many immigrants come to the United States with little money they often are willing to take risks that can result in high incomes. However, is this enough to overcome language and culture difficulties?a. Is there sufficient evidence to infer that Americans born in the United States (BORN: 1
In most countries including the United States, younger people tend to be on the left side of the political spectrum. If so, we would expect Republicans to be older than Democrats.a. Conduct a test to determine whether there is enough evidence to infer that Republicans (PARTYID3: 1 = Democrat; 3 =
Republicans tend to prefer smaller less intrusive government and lower taxes. Is this because Republicans have higher incomes (PARTYID3: 1 = Democrat; 3 = Republican)?a. Do the data allow us to conclude that Republicans earn more income (RINCOME) than Democrats?b. Estimate how much more Republicans
Refer to Exercise 13.59. If it is true that Republicans (PARTYID3: 1 = Democrat; 3 = Republican) have higher incomes than Democrats, is it because they work harder?a. Conduct a statistical test to determine whether Republicans work longer hours (HRS1).Use a 5% significance level for all tests. Use
Does education play a role to explain the results in Exercise 13.59.a. Test to determine whether there is enough evidence to infer that Republicans (PARTYID3: 1 = Democrat; 3 = Republican) more educated than Democrats (EDUC).b. Estimate the difference in years of education between Democrats and
Perhaps another way to explain the outcome of the test in Exercise 13.59 is that Republicans wait longer to have children.a. Test to determine whether Republicans are older than Democrats (PARTYID3: 1 = Democrat; 3 = Republican) when their first child is born (AGEKDBRN)b. Are the required
We can attempt to explain the results in Exercise 13.63 by determining whether Conservatives are more educated than Liberals (POLVIEWS3: 1 = Liberal, 3 = Conservative). Test to determine whether Conservatives have more education than Liberals (EDUC). What does the p-value mean?
As was the case with Democrats and Republicans we would expect that Conservatives would have higher incomes (POLVIEWS3: 1 = Liberal, 3 = Conservative)a. Conduct a statistical test to determine whether we can conclude that Conservatives, income exceeds that of Liberals (RINCOME).b. Are the required
Another way to explain the results of Exercise 13.64 is to look at the differences in the number of hours of work.a. Is there sufficient evidence to infer that Conservatives work longer hours than Liberals (POLVIEWS3: 1 = Liberal, 3 = Conservative) (HRS1)?b. Are the required conditions satisfied?c.
Are government jobs more complex requiring more education than do private sector jobs?a. Test to determine whether there is enough evidence to conclude that government workers (WRKGOVT: 1 = Government, 2 = Private) have more education than do private sector employees (EDUC).b. Are the required
As a general rule government employees (WRKGOVT: 1 = Government, 2 = Private) have more job security than do private sector employees. Do they also have higher incomes RINCOME)?a. Conduct a test to answer the question.b. Are the required conditions satisfied?c. If the required conditions are not
The upside to working for self-employment is that there is virtually no upper limit to income. If so, we would expect self-employed individuals (WRKSLF: 1 = Self-employed, 2 = Someone else) to have higher incomes (RINCOME).a. Conduct a test to determine whether the expectation is true.b. Are the
Incomes of people who work for themselves are likely more variable than people who work for someone else. That’s because incomes for someone who is self employed range from $0 to virtually unlimited.a. Is there sufficient evidence that middle class heads of households who work for someone else
In most countries including the United States, men have higher incomes than women. Does this hold when comparing middle class heads of households (HHSEX: 1 = male, 2 = female)?a. Is there sufficient evidence that male heads of households have higher incomes than do female heads of households
Refer to Exercises 13.33 and 13.101. Explain why the matched pairs experiment produced significant results whereas the independent samples t-test did not.
Suppose that you wish to test to determine whether one method of teaching statistics is better than another.a. Describe a data-gathering process that produces observational data.b. Describe a data-gathering process that produces experimental data.
Are the data in Exercise 13.18 observational or experimental? Explain. If the data are observational, describe a method of producing experimental data.
Refer to Exercise 13.17. If the data are observational, describe another conclusion other than the one that infers that Tastee is better for babies.
The best way of winning at blackjack is to “case the deck,” which involves counting 10s, non-10s, and aces. For card counters, the probability of winning a hand may increase to 52%. Repeat Exercise 7.102 for a card counter.
Several books teach blackjack players the “basic strategy,” which increases the probability of winning any hand to 50%. Repeat Exercise 7.102, assuming the player plays the basic strategy.
The probability of winning a game of craps (a dicethrowing game played in casinos) is 244/495.a. What is the probability of winning 5 or more times in 10 games?b. What is the probability of winning in 50 or more times in 100 games?
According to a recent Gallop poll only 29% of American adults said they were satisfied with the way things are going in the United States. Suppose you randomly select 10 American adults and ask each whether they are satisfied with the way things are going in the United States.a. What is the
In a recent survey the Pew Research Center asked graduates of private universities whether they were satisfied with their current job and 72% said they were. Suppose you take a sample of four private university graduates and ask each whether they are satisfied with their current jobs.a. What is the
Dermatologists strongly recommend that people who are exposed to sunlight should either be covered up or put on sunscreen. Suppose that at a Florida condominium pool only a quarter of residents sit around the pool in the sun with no sunscreen.a. What is the probability that in a random sample of 10
According to a Pew Research Center survey 30% of graduates who had student loans are delinquent (90 or more days behind in their payments. Suppose that a survey of 10 such graduates is taken.a. What is the probability that 3 are delinquent?b. What is the probability that 3 or more are delinquent?
According to a Gallup poll 27% of American adults have confidence in banks. Suppose that you interview 5 Americans adults at random.a. What is the probability that 2 or fewer have confidence in banks?b. What is the probability that no one had confidence in banks?c. What is the probability that 3 or
According to the American Academy of Cosmetic Dentistry, 75% of adults believe that an unattractive smile hurts career success. Suppose that 25 adults are randomly selected.a. What is the probability that 15 or more of them would agree with the claim?b. What is the probability that less than 14
The leading brand of dishwasher detergent has a 30% market share. A sample of 25 dishwasher detergent customers was taken.a. What is the probability that 10 or fewer customers chose the leading brand?b. What is the probability that 11 or more customers chose the leading brand?c. What is the
A Jiffy Lube franchise manager is concerned about the amount of time it takes for his technicians to change the oil and filters of cars. The current mean time for the complete operation is 18 minutes. He hasn’t kept track of the number of times his employees took more than 30 minutes to complete
Use the χ2 table (Table 5) to find the following values of χ2.a. χ2 .90, 26 b. χ2 .01, 30 c. χ2 .10, 1 d. χ2 .99, 80
Use the F table (Table 6) to find the following values of F.a. F.05, 3, 7 b. F.05, 7, 3 c. F.025, 5, 20 d. F.01, 12, 60
Use the F table (Table 6) to find the following values of F.a. F.025, 8, 22b. F.05, 20, 30c. F.01, 9, 18d. F.025, 24, 10
Refer to Exercises 9.9–9.11. What do the probabilities tell you about the variances of X and X?
Refer to Exercise 9.13. Suppose that the population is not normally distributed. Does this change your answer? Explain.
Repeat Exercise 9.15 with n = 100.In exercise 9.15A sample of n = 16 observations is drawn from a normal population with μ = 1,000 and σ = 200.Find the following.a. P(X̅ > 1,050)b. P(X̅ < 960)c. P(X̅ > 1,100)
Refer to Exercise 9.23. If the population of women’s heights is not normally distributed, which, if any, of the questions can you answer? Explain. In exercise 9.23The heights of North American women are normally distributed with a mean of 64 inches and a standard deviation of 2 inches.a.
Statisticians determined that the mortgages of homeowners in a city is normally distributed with a mean of $250,000 and a standard deviation of $50,000. A random sample of 100 homeowners was drawn. What is the probability that the mean is greater than $262,000?
Refer to Exercise 9.26. Does your answer change if you discover that mortgages are not normally distributed?
The sign on the elevator in an office tower states, “Maximum Capacity 1,140 kilograms (2,500 pounds) or 16 Persons.” A professor of statistics wonders what the probability is that 16 persons would weigh more than 1,140 kilograms. Discuss what the professor needs (besides the ability to perform
Refer to Exercise 9.36. Does your answer change if you discover that the times needed to mark a midterm test are not normally distributed?
The property tax paid by homeowners in a large city was determined to be normally distributed with a mean of $2,800 and a standard deviation of $400. A random sample of four homes was drawn.a. What is the probability distribution of the mean of the sample of four homes?b. Determine the probability
How would you answer Exercise 9.40 if property tax is not normally distributed?
Refer to Exercise 9.55. A survey of a random sample of 1,200 undergraduate business students indicates that 336 students plan to major in accounting. What does this tell you about the professor’s claim?In exercise 9.55An accounting professor claims that no more than one-quarter of undergraduate
In 2014, approximately 13% of nonelderly Americans adults had no health insurance. Suppose that a random sample of 400 such individuals was drawn. What is the probability that 15% or more had no health insurance?
In a Gallup survey, Americans were asked about their main source of news about current events around the world. If 20% of the population report that their main source is television news, find the probability that in a sample of 500 at least 22% say that their source of news is television.
Most televised baseball games display a pitch tracker that shows whether the pitch was in the strike zone, which in turn shows whether the umpire made the correct call. Major League Baseball keeps track of how well each umpire calls games. Batters swing at approximately 47% of all pitches. As a
Repeat Exercise 9.59 for the worst umpire.In exercise 9.59Most televised baseball games display a pitch tracker that shows whether the pitch was in the strike zone, which in turn shows whether the umpire made the correct call. Major League Baseball keeps track of how well each umpire calls games.
Repeat Exercise 9.61 with samples of size 50.In exercise 9.61Independent random samples of 10 observations each are drawn from normal populations. The parameters of these populations arePopulation 1: μ = 280, σ = 25Population 2: μ = 270, σ = 30Find the probability that the mean of sample 1 is
Repeat Exercise 9.61 with samples of size 100.In exercise 9.61Independent random samples of 10 observations each are drawn from normal populations. The parameters of these populations arePopulation 1: μ = 280, σ = 25Population 2: μ = 270, σ = 30Find the probability that the mean of sample 1 is
Repeat Exercise 9.64 assuming that the standard deviations are 12 and 16, respectively.In exercise 9.64Suppose that we have two normal populations with the means and standard deviations listed here. If random samples of size 25 are drawn from each population, what is the probability that the mean
Repeat Exercise 9.64 assuming that the means are 140 and 138, respectively.In exercise 9.64Suppose that we have two normal populations with the means and standard deviations listed here. If random samples of size 25 are drawn from each population, what is the probability that the mean of sample 1
Is the sample median a consistent estimator of the population mean? Explain.
Show that the sample mean is relatively more efficient than the sample median when estimating the population mean.
Among the most exciting aspects of a university professor€™s life are the departmental meetings where such critical issues as the color of the walls will be painted and who gets a new desk are decided. A sample of 20 professors was asked how many hours per year are devoted to these
The number of cars sold annually by used car salespeople is normally distributed with a standard deviation of 15. A random sample of 15 salespeople was taken, and the number of cars each sold is listed here. Find the 95% confidence interval estimate of the population mean. Interpret the interval
It is known that the amount of time needed to change the oil on a car is normally distributed with a standard deviation of 5 minutes. The amount of time to complete a random sample of 10 oil changes was recorded and listed here. Compute the 99% confidence interval estimate of the mean of the
One of the few negative side effects of quitting smoking is weight gain. Suppose that the weight gain in the 12 months following a cessation in smoking is normally distributed with a standard deviation of 6 pounds. To estimate the mean weight gain, a random sample of 13 quitters was drawn; their
The rising cost of electricity is a concern for homeowners. An economist wanted to determine how much electricity has increased over the past 5 years. A survey was conducted with the percentage increase recorded. Assuming that the population standard deviation is known to be 20% estimate the mean
How much do American families spend on entertainment each month. A survey was conducted and the amounts spent on entertainment in the previous month were recorded. Assuming that the population standard deviation is $50 determine the 99% confidence interval estimate of the mean monthly amount of
Registered Retirement Savings Plan are retirement plans that defer taxes. Many Canadians rely on these plans for their retirement. To measure how these are doing, a random sample of 60-yearold Canadians was drawn and asked to report the total value of their RRSPs. If the population standard
It is the responsibility of the federal government to judge the safety and effectiveness of new drugs. There are two possible decisions: approve the drug or disapprove the drug.Feature nonstatistical applications of hypothesis testing. For each, identify the hypotheses, define Type I and Type II
You are contemplating a Ph.D. in business or economics. If you succeed, a life of fame, fortune, and happiness awaits you. If you fail, you’ve wasted 5 years of your life. Should you go for it?Feature nonstatistical applications of hypothesis testing. For each, identify the hypotheses, define
You are the centerfielder of the New York Yankees. It is the bottom of the ninth inning of the seventh game of the World Series. The Yanks lead by 2 with 2 outs and men on second and third. The batter is known to hit for high average and runs very well but only has mediocre power. A single will tie
You are the pilot of a jumbo jet. You smell smoke in the cockpit. The nearest airport is less than 5 minutes away. Should you land the plane immediately?feature nonstatistical applications of hypothesis testing. For each, identify the hypotheses, define Type I and Type II errors, and discuss the
Research objective: The population mean is greater than 7.5.σ = 1.5, n = 30, x̅ = 8.5Calculate the p-value of the test to determine that there is sufficient evidence to infer each research objective.
Research objective: The population mean is not equal to 1,500.σ = 220, n = 125, x̅ = 1525Calculate the p-value of the test to determine that there is sufficient evidence to infer each research objective.
Calculate the value of the test statistic, set up the rejection region, determine the p-value, interpret the result, and draw the sampling distribution.H0: μ = 15H1: μ < 15σ = 2, n = 25, x = 14.3, α = .10
Research objective: The population mean is less than 250.σ = 40, n = 70, x̅ = 240
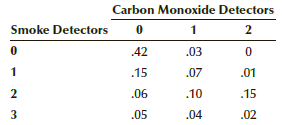
A fire inspector has conducted an extensive analysis of the number of smoke detectors and the number of carbon monoxide detectors in the homes in a large city. The analysis led to the creation of the following bivariate probability distribution.a. What proportion of homes have no carbon monoxide
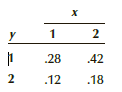
Refer to Exercise 7.49. Use the laws of expected value and variance of the sum of two variables to compute the mean and variance of X + Y .In exercise 7.49The bivariate distribution of X and Y is described here. х .28 42 .12 .18
Refer to Exercise 7.49. Compute the covariance and the coefficient of correlation.In exercise 7.49The bivariate distribution of X and Y is described here.a. Find the marginal probability distribution of X.b. Find the marginal probability distribution of Y .c. Compute the mean and variance of X.d.
Refer to Exercise 7.49.a. Determine the distribution of X + Y.b. Determine the mean and variance of X + Y.c. Does your answer to part (b) equal the answer to Exercise 7.49?In exercise 7.49The bivariate distribution of X and Y is described here. х .28 42 .12 .18
Refer to Exercise 4.95. In another survey by the Bureau of Labor Statistics respondents who reported that they rent their dwelling were asked their age and how much they spend annually on rent. Use a statistical analysis to determine whether the data indicate that as renters grow older they spend
To determine the relationship between age of cars and annual repair costs a random sample of car owners was drawn and the two variables were recorded. Calculate statistics to determine whether cost of repairs increase as the car ages and on average what is the cost.
A professional income tax preparer recorded the amount of tax rebate and the total taxable amount of a sample of 80 customers. Compute whichever statistics you need to determine whether tax rebates increase as the taxable income increases.
Carbon monoxide (CO) in the home is caused by faulty furnaces burning natural gas or heating oil. Concentrations above 35 parts per million (ppm) is considered dangerous. Suppose that a municipal home inspector randomly samples 180 houses around the city and records the age of the furnace and the
The U.S.–Canada exchange rate has fluctuated over the past 45 years. Can any single commodity explain these fluctuations? Is it oil, for example? Canada sells a lot of oil to the United States. It may be lumber or gold. A statistician set out to investigate the U.S.–Canada exchange rate and
The number of wins, team payrolls, home attendance, and away attendance were recorded for the 2015–2016 a. Conduct an analysis to determine the marginal cost of winning one more game.b. Analyze the relationship between games won and home attendance. What is the marginal number of tickets
Repeat Exercise 4.105 for the 2012–2013 National Basketball Association season.Data from 4.105The number of wins, team payrolls, home attendance, and away attendance were recorded for the 2015–2016 National Basketball Association season.a. Conduct an analysis to determine the marginal cost of
Repeat Exercise 4.107 for the 2012–2013 National Football League seasonData from 4.107The number of wins, team payrolls, home attendance, and away attendance were recorded for the 2015–2016 National Football League season.a. Estimate the marginal cost of winning one more game.b. Estimate the
The number of wins, team payrolls, home attendance, and away attendance were recorded for the 2015–2016 National Football League season.a. Estimate the marginal cost of winning one more game.b. Estimate the marginal number of tickets sold for each additional game won?c. Repeat part (b) for away
We recorded the number of wins, team payrolls, home attendance, and away attendance for the 2015–2016 National Hockey League season.a. Estimate the marginal cost of winning one more game.b. Estimate the marginal number of tickets sold for each additional game won?c. Repeat part (b) for away
Repeat Exercise 4.109 for the 2012–2013.Data from 4.109We recorded the number of wins, team payrolls, home attendance, and away attendance for the 2015–2016 National Hockey League season.a. Estimate the marginal cost of winning one more game.b. Estimate the marginal number of tickets sold for
Dow Jones Industrials stocks listed on the New YorkStock Exchange (The other four are on the NASDAQ.) for the period January 2011– December 2015.3M (MMM)American Express (AXP)Boeing (BA)Caterpillar (CAT)Chevron (CVX)Coca-Cola (KO)Disney (DIS)Du Pont (DD)Exxon (XOM)General Electric (GE)Goldman
Monthly returns for the Toronto Stock Exchange Index and the following selected stocks on the Toronto Stock Exchange were recorded for the years 2011 to 2015:Barrick Gold (ABX)Bombardier (BBD.B)Bell Canada Enterprises (BCE)Bank of Montreal (BMO)Bank of Nova Scotia (BNS)Canadian Imperial Bank of
We calculated the returns on the NASDAQ Index and the following selected stocks on the NASDAQ Exchange for the period January 2011–December 2015.Adobe Systems (ADBE)Amazon (AMZN)Amgen (AMGN)Apple (AAPL)Bed Bath & Beyond (BBBY)Cisco Systems (CSCO)Comcast (CMCSA)Costco Wholesale (COST)Dollar
Calculate the coefficient of determination for Exercise 3.58. Is this more informative than the scatter diagram?
Refer to Exercise 3.59. Compute the coefficients of the least squares line and compare your results with the scatter diagram.
Compute the coefficient of determination and the least squares line for Exercise 3.64.Compare this information with that developed by the scatter diagram alone.
Refer to Exercise 3.67. Calculate the coefficient of determination and the least squares line. Is this more informative than the scatter diagram?
a. Calculate the coefficients of the least squares line for the data in Example 3.7.b. Interpret the coefficients.c. Is this information more useful than the information extracted from the scatter diagram?
In Exercise 4.71 you calculated quartiles. Draw histograms instead and compare the results.
Refer to Exercise 4.74. Draw histograms of the data. What have you learned?
Calculate the coefficient of correlation of the amount of education of the respondents and their spouses (EDUC and SPEDUC). What does this statistic tell you about the relationship between the two variables?
Is someone’s education (EDUC) affected by his or her father’s education (PAEDUC)? Use a statistical analysis to answer the following questions:a. How strong is the linear relationship between the two variables?b. What is the average marginal increase in the number of years of the respondent’s
Repeat Exercise 4.146 for the respondents’ mothers education (MAEDUC).Data from 4.146Is someone’s education (EDUC) affected by his or her father’s education (PAEDUC)? Use a statistical analysis to answer the following questions:a. How strong is the linear relationship between the two
Showing 900 - 1000
of 1191
1
2
3
4
5
6
7
8
9
10
11
12
Step by Step Answers