New Semester
Started
Get
50% OFF
Study Help!
--h --m --s
Claim Now
Question Answers
Textbooks
Find textbooks, questions and answers
Oops, something went wrong!
Change your search query and then try again
S
Books
FREE
Study Help
Expert Questions
Accounting
General Management
Mathematics
Finance
Organizational Behaviour
Law
Physics
Operating System
Management Leadership
Sociology
Programming
Marketing
Database
Computer Network
Economics
Textbooks Solutions
Accounting
Managerial Accounting
Management Leadership
Cost Accounting
Statistics
Business Law
Corporate Finance
Finance
Economics
Auditing
Tutors
Online Tutors
Find a Tutor
Hire a Tutor
Become a Tutor
AI Tutor
AI Study Planner
NEW
Sell Books
Search
Search
Sign In
Register
study help
mathematics
statistics informed decisions
Statistics Informed Decisions Using Data 4th Edition Michael Sullivan III - Solutions
Sleeping Revisited Refer to the “Sleeping” results from Problem 24. What could be done to increase the precision of the confidence interval?Data from problem 24A 90% confidence interval for the number of hours that full-time college students sleep during a weekday is lower bound: 7.8 hours and
For the “Hours Worked” survey conducted by Gallup in Problem 23, provide two recommendations for increasing the precision of the interval.Data from problem 23In a survey conducted by the Gallup organization, 1100 adult Americans were asked how many hours they worked in the previous week. Based
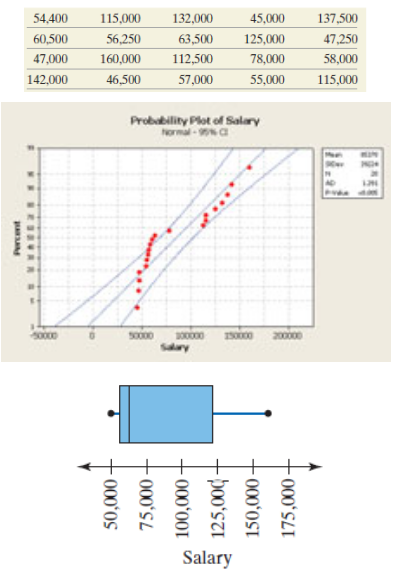
A random sample of recent graduates of law school was obtained in which the graduates were asked to report their starting salary. The data, based on results reported by the National Association for Law Placement, are as follows: 54,400 115,000 132,000 45,000 137,500 47,250 60,500 56,250 63,500
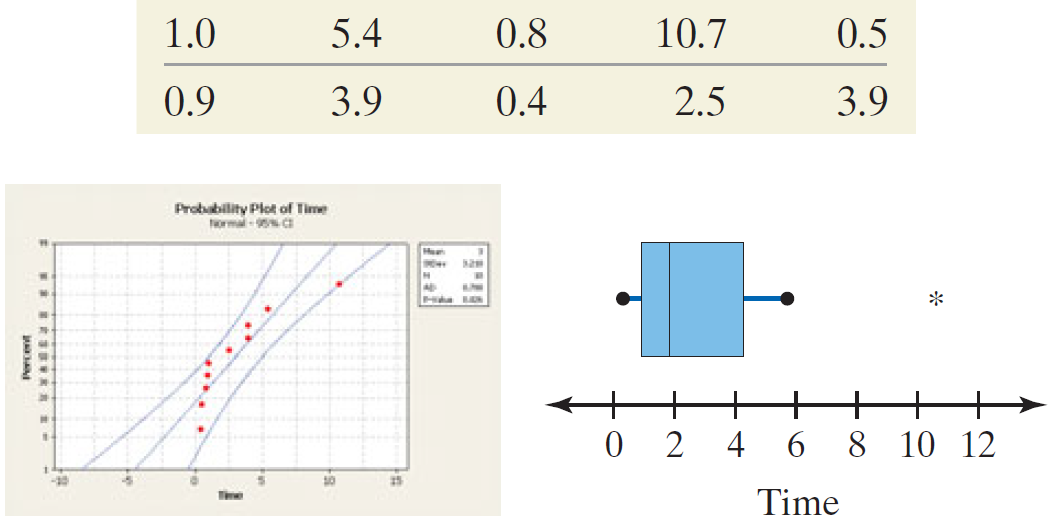
A police officer hides behind a billboard to catch speeders. The following data represent the number of minutes he waits before first observing a car that is exceeding the speed limit by more than 10 miles per hour on 10 randomly selected days: 0.8 1.0 5.4 10.7 0.5 3.9 0.9 0.4 2.5 3.9 Probability
The following data represent the prices for a 4 GB flash memory card from online retailers. Treat these data as a simple random sample of all online retailers. In Problem 35 from Section 9.2, it was verified that the data are normally distributed and that s = 2.343 dollars. Construct and interpret
The acronym ANOVA stands for ____________.
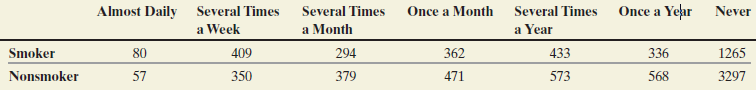
Many municipalities are passing legislation that forbids smoking in restaurants and bars. Bar owners claim that these laws hurt their business. Are their concerns legitimate? The following data represent the smoking status and frequency of visits to bars from the General Social Survey. Do smokers
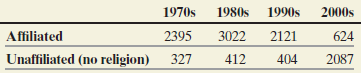
The General Social Survey regularly asks individuals to disclose their religious affiliation. The following data represent the religious affiliation of young adults, aged 18 to 29, in the 1970s, 1980s, 1990s, and 2000s. Do the data suggest different proportions of 18- to 29-year-olds have been
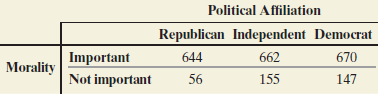
In a poll conducted by Harris Poll, a random sample of adult Americans was asked, “How important are moral values when deciding how to vote?” The results of the survey by disclosed political affiliation are shown in the table.(a) Do the sample data suggest that the proportion of adults who feel
A researcher wanted to determine if the distribution of educational attainment of Americans today is different from the distribution in 2000. The distribution of educational attainment in 2000 was as follows:Education
In the Sullivan Statistics Survey, respondents were asked to disclose their political philosophy (Conservative, Moderate, Liberal) and also answer the following question: “Is a language other than English the primary language spoken in your home?” Create a contingency table and determine
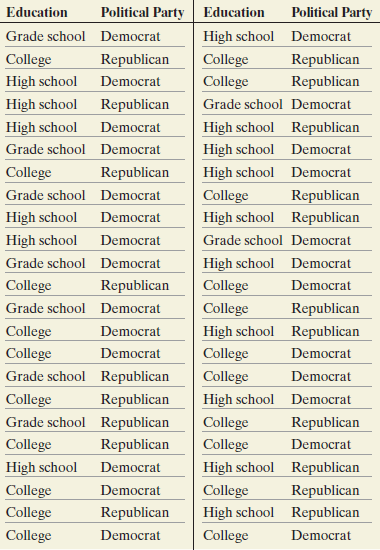
A political scientist wanted to learn whether there is any association between the education level of a registered voter and his or her political party affiliation. He randomly selected 46 registered voters and obtained the following data:(a) Construct a contingency table for the two variables.(b)
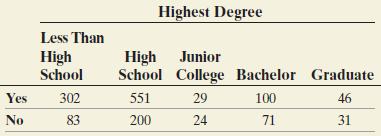
Do you believe everyone has an equal opportunity to obtain a quality education in the United States? The results of this General Social Survey question are presented next by level of education.(a) Does the evidence suggest that the proportion of individuals who feel everyone has an equal
Explain why chi-square goodness-of-fit tests are always right tailed.
Statistical software and graphing calculators with advanced statistical features use random-number generators to create random numbers conforming to a specified distribution.What proportion of the numbers generated should be 0? 1? 2? 3? 4? 5?
In Example 2 we found that there was not enough evidence to support the conclusion that the distribution of the population in the United States was shifting. The following table shows the results of a survey of n = 5000 households.Region
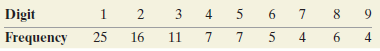
The Fibonacci sequence is a famous sequence of numbers whose elements commonly occur in nature. The terms in the Fibonacci sequence are 1, 1, 2, 3, 5, 8, 13, 21, . . . . The ratio of consecutive terms approaches the golden ratio, Ф = 1 + √5 / 2. The distribution of the first digit of the first
A school social worker wants to determine if the grade distribution of home-schooled children is different in her district than nationally. The U.S. National Center for Education Statistics provided her with the following data, which represent the relative frequency of home-schooled children by
In 2008, Malcolm Gladwell released his book Outliers. In the book, Gladwell claims that more hockey players are born in January through March than in October through December. The following data show the number of players selected in the 2010 National Hockey League draft according to their birth
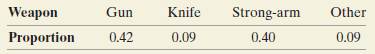
Nationally, the distribution of weapons used in robberies is as shown in the table.The data on the following page represent the weapon of choice in 1652 robberies on school property.(a) Does the distribution of weapon choice in robberies in schools follow the national distribution? Use the a = 0.05
What are the two requirements that must be satisfied to perform a goodness-of-fit test?
Suppose there are n independent trials of an experiment with k > 3 mutually exclusive outcomes, where pi represents the probability of observing the ith outcome. The _____________for each possible outcome are given by Ei = _______________.
A ______________ test is an inferential procedure used to determine whether a frequency distribution follows a specific distribution.
You want to invest in a stock and have narrowed your choices down to either Citibank (C) or Wells Fargo (WFC). To help you decide which stock to invest in, you decide to compare weekly rates of return for the two stocks. Which would be a better sampling plan: (a) randomly choose 15 weeks and
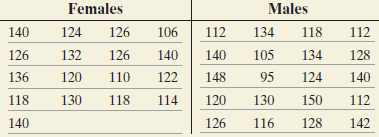
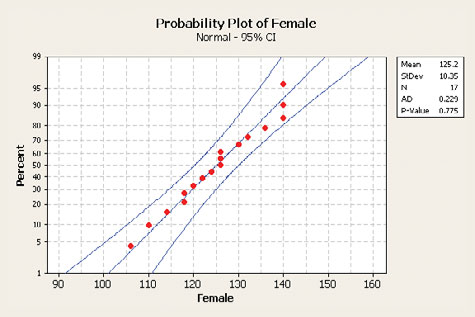
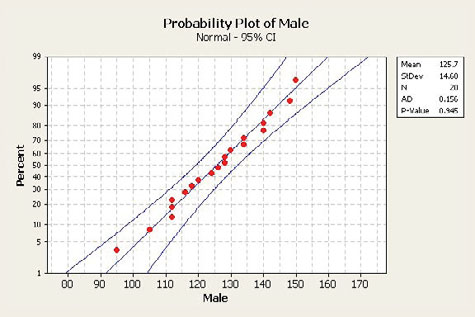
A nurse was interested in discovering whether men have more variability in their systolic blood pressure than women. She randomly selects 20 males and 17 females from the surgical floor of her hospital and records their systolic blood pressures. The data are as follows: (a) Given the
Refer to Problem 5. Determine the probability of making a Type II error if the true population proportion is 0.63. Assume the test is conducted at the a = 0.05 level of significance. What is the power of the test?Data from problem 5In many parliamentary procedures, a supermajority is defined as an
Standard deviation rate of return is a measure of risk in the stock market. An investment manager claims that the standard deviation rate of return for his portfolio is less than the general market, which is known to be 18%. Treating the past 10 years as a random sample, you find the standard
A test is conducted at the a = 0.05 level of significance. What is the probability of a Type I error?
How do the probability of making a Type II error and effect size play a role in determining an appropriate sample size when performing a hypothesis test?
What effect does increasing the sample size have on the power of the test, assuming all else remains unchanged?
To test H0: p = 0.40 versus H1: p 7 0.40, a simple random sample of n = 200 individuals is obtained and x = 84 successes are observed.(a) What does it mean to make a Type II error for this test?(b) If the researcher decides to test this hypothesis at the a = 0.05 level of significance, compute the
Explain what it means to make a Type II error.
A simple random sample of size n = 16 is drawn from a population that is normally distributed. The sample variance is found to be 13.7. Test whether the population variance is greater than 10 at the a = 0.05 level of significance.
(a) Determine the critical value for a right-tailed test of a population standard deviation with 16 degrees of freedom at the a = 0.01 level of significance.(b) Determine the critical value for a left-tailed test of a population standard deviation for a sample of size n = 14 at the a =
The headline reporting the results of a poll conducted by the Gallup organization stated “Majority of Americans at Personal Best in the Morning.” The results indicated that a survey of 1100 Americans resulted in 55% stating they were at their personal best in the morning. The poll’s results
Explain what “statistical significance” means.
The following is a quotation from Sir Ronald A. Fisher, a famous statistician.For the logical fallacy of believing that a hypothesis has been proved true, merely because it is not contradicted by the available facts, has no more right to insinuate itself in statistics than in other kinds of
The _________________ is the probability of making a Type I error.
The given data represent the wait time (in seconds) for a random sample of 14 individuals before connecting with a customer service agent.(a) A boxplot of the data is shown next. The quality control manager of the customer service department wants to estimate the mean wait time. Explain why you
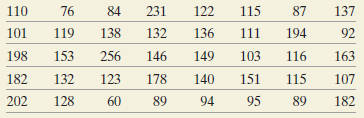
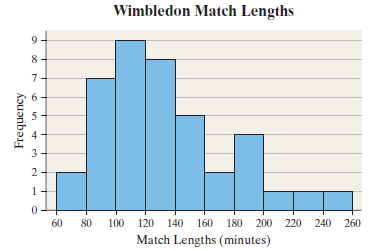
A tennis enthusiast wants to estimate the mean length of men’s singles matches held during the Wimbledon tennis tournament. From the Wimbledon history archives, he randomly selects 40 matches played during the tournament since the year 1968 (when professional players were first allowed to
Find the critical values x21-a>2 and x2a>2 required to construct a confidence interval about σ for the given level of confidence and sample size.(a) 98% confidence; n = 16(b) 90% confidence; n = 30
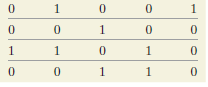
To estimate proportions using bootstrapping methods, report successes as 1 and failures as 0. Then follow the sample procedures that we used to estimate a mean using bootstrapping. Suppose a random sample of 20 individuals was asked if the Internet is their main source of news. In the data, a 1
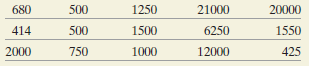
The following data represent the annual 2011 salary (in thousands of dollars) of a random sample of professional baseball players.(a) Draw a boxplot of the data. Explain why a t-interval cannot be constructed.(b) Construct a 95% confidence interval for the mean and median salary of a professional
The following data represent the prices for a 4 GB flash memory card from online retailers. Treat these data as a simple random sample of all online retailers. In Problem 35 from Section 9.2, we obtained a 95% confidence interval for the mean price.(a) Construct a 95% confidence interval for the
The 112th Congress of the United States of America has 535 members, of which 87 are women. An alien lands near the U.S. Capitol and treats members of Congress as a random sample of the human race. He reports to his superiors that a 95% confidence interval for the proportion of the human race that
A Bernoulli random variable is a variable that is either 0 (a failure) or 1 (a success). The probability of success is denoted p.(a) What proportion of the intervals do you expect to include the population proportion, p? What proportion of the intervals actually captures the population proportion?
In Problem, determine the critical value za/2 that corresponds to the given level of confidence. 90%
The value za/2 represents the ___________________of the distribution.
A ______________is the value of a statistic that estimates the value of a parameter.
In a town of 500 households, 220 have a dog. The population proportion of dog owners in this town (expressed as a decimal) is p = ______________.
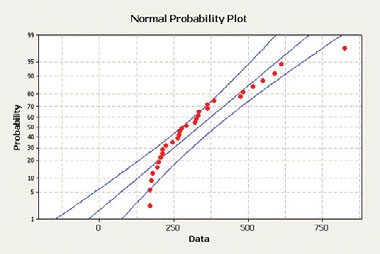
In Problem, a normal probability plot of a simple random sample of data from a population whose distribution is unknown was obtained. Given the normal probability plot, is there reason to believe the population is normally distributed? Normal Probability Plot 70 20 10 250 S00 750 Data
Find the value of z0.04.
You suspect a pair of dice to be loaded and conduct a probability experiment by rolling each die 400 times. The outcome of the experiment is listed in the table below. Do you think the dice are loaded? Why?
In January 2011, the mean amount of money lost per visitor to a local riverboat casino was $135. Do you think the median was more than, less than, or equal to this amount? Why?
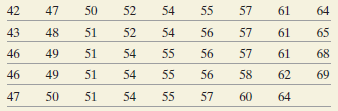
The data below represent the ages of the presidents of the United States (from George Washington through Barack Obama) on their first days in office.President Cleveland’s age is listed twice, 47 and 55, because he is historically counted as two different presidents, numbers 22 and 24, since his
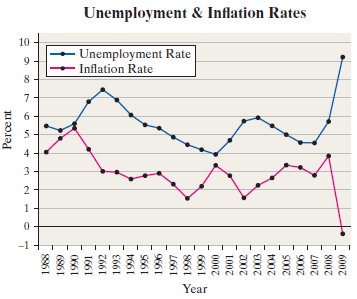
The following time-series plot shows the annual unemployment and inflation rates for the years 1988 through 2009.(a) Estimate the unemployment and inflation rates for 1992.(b) Estimate the unemployment and inflation rates for 2009. (c) The misery index is defined as the sum of the unemployment
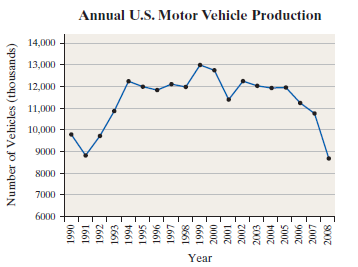
The following time-series graph shows the annual U.S. motor vehicle production from 1990 through 2008.(a) Estimate the number of motor vehicles produced in the United States in 1991.(b) Estimate the number of motor vehicles produced in the United States in 1999.(c) Use your results from (a) and (b)
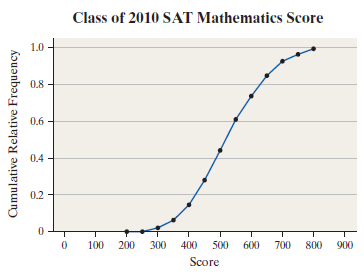
The following relative frequency ogive represents the SAT math scores of college-bound students.(a) What is the class width? How many classes are represented in the graph?(b) What are the lower and upper limits of the first class?(c) What are the lower and upper limits of the last class?(d)
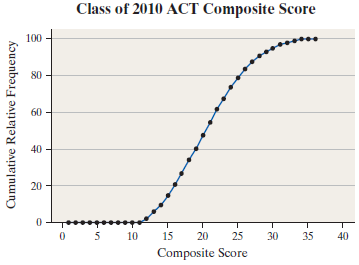
The relative frequency ogive on the following page represents the ACT composite score for the high school graduating class of 2010.(a) Estimate the percentage of students who had a composite score of 16 or below.(b) Estimate the percentage of students who had a composite score of 19 or above.(c) If
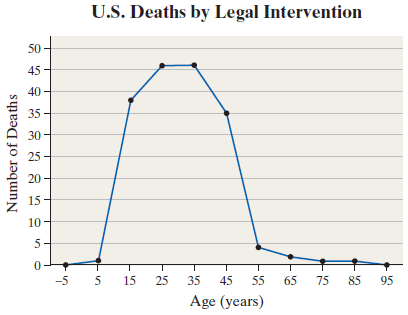
Deaths by legal intervention refers to injuries inflicted by law-enforcement agents in the course of arresting or attempting to arrest lawbreakers, suppressing disturbances, maintaining order, and other legal action (including legal execution). In 2006, 174 such deaths occurred in 16 states in the
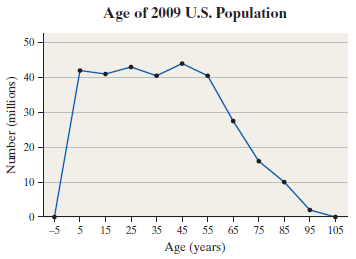
Age of Population The following frequency polygon shows the age distribution of U.S. residents below 100 years of age on July 1, 2009.(a) What is the class width? How many classes are represented in the graph?(b) What is the midpoint of the first class? What are the lower and upper limits of the
What are time-series data?
What is an ogive?
A poll is conducted in which 500 people are asked whom they plan to vote for in the upcoming election.
Researchers wanted to know if there is a link between proximity to high-tension wires and the rate of leukemia in children. To conduct the study, researchers compared the rate of leukemia for children who lived within 1/2 mile of high-tension wires to the rate of leukemia for children who did not
Discuss the differences between discrete and continuous variables.
Only 12 men have walked on the moon. The average age of these men at the time of their moonwalks was 39 years, 11 months, 15 days.
Use In a national survey on substance abuse, 10.0% of respondents aged 12 to 17 reported using illicit drugs within the past month.
Following the 2010 national midterm election, 18% of the governors of the 50 United States were female. - parameter
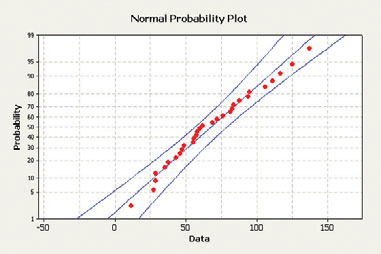
In Problem, a normal probability plot of a simple random sample of data from a population whose distribution is unknown was obtained. Given the normal probability plot, is there reason to believe the population is normally distributed? Normal Probability Plot 95 80 20 10 50 -50 100 150 Data
Find the value of z0.20.
If X is normal random variable with mean 40 and standard deviation 10 and P(X < 38) = 0.4207, then P (X ≤ 38) = _______________.
If X is a normal random variable with mean 40 and standard deviation 10 and P(X > 45) = 0.3085, then P(X < 35) = __________.
The notation za is the z-score that the area under the standard normal curve to the right of za is ___________.
The number of cars that arrive at a bank’s drive-through window between 3:00 p.m. and 6:00 p.m. on Friday follows a Poisson process at the rate of 0.41 car every minute. Compute the probability that the number of cars that arrive at the bank between 4:00 p.m. and 4:10 p.m. is:(a) Exactly four
Data from the National Center for Health Statistics show that spina bifida occurs at the rate of 28 per 100,000 live births. Let the random variable X represent the number of occurrences of spina bifida in a random sample of 100,000 live births.(a) What is the expected number of children with spina
According to the National Center for Health Statistics, the common cold occurs at the rate of 23.6 colds per 100 people during the course of a year in the 18- to 24-year-old age group. Let the random variable X represent the number of 18- to 24-year-olds out of a sample of 500 who have had a common
From 1900 to 2010 (111 years), Florida suffered 29 direct hits from major (category 3 to 5) hurricanes. Assume that this was typical and the number of hits per year follows a Poisson distribution. (a) What is the probability that Florida will not be hit by any major hurricanes in a single
In Problem, the random variable X follows a Poisson process with the given mean.Assuming μ = 7, compute(a) P(10) (b) P(X < 10)(c) P(X ≥ 10) (d) P(7 ≤ X ≤ 9)
The potholes on a major highway in the city of Madison occur at the rate of 3.4 per mile. The random variable X is the number of potholes in 10 miles of randomly selected highway.
The flaws in a piece of timber occur at the rate of 0.07 per linear foot. The random variable X is the number of flaws in the next 20 linear feet of timber.
The phone calls to a computer software help desk occur at the rate of 5 per minute between 3:00 p.m. and 4:00 p.m. The random variable X is the number of phone calls between 3:10 p.m. and 3:20 p.m.
The hits to a Web site occur at the rate of 10 per minute between 7:00 p.m. and 9:00 p.m. The random variable X is the number of hits between 7:30 p.m. and 7:35 p.m.
State the conditions required for a random variable X to follow a Poisson process.
If the 2011 Hyundai Genesis has 2 engine types, 2 vehicle styles, 3 option packages, 8 exterior color choices, and 2 interior color choices, how many different Genesis’s are possible?
List all combinations of five objects a, b, c, d, and e taken three at a time without replacement.
Compute the probability of the event F = “a number divisible by three.”For Problems, let the sample space be S = {1, 2, 3, 4, 5, 6, 7, 8, 9, 10}. Suppose that the outcomes are equally likely.
Compute the probability of the event E = {1, 3, 5, 10}.For Problem, let the sample space be S = {1, 2, 3, 4, 5, 6, 7, 8, 9, 10}. Suppose that the outcomes are equally likely.
How many distinguishable DNA sequences can be formed using one A, four Cs, three Gs, and four Ts?
How many distinguishable DNA sequences can be formed using three As, two Cs, two Gs, and three Ts?
If two events E and F are independent, P(E and F ) = _____ .
The golf ball is not a Top-Flite.In Problems, a golf ball is selected at random from a golf bag. If the golf bag contains 9 Titleists, 8 Maxflis, and 3 Top-Flites, find the probability of each event.
The golf ball is not a Titleist.In Problems, a golf ball is selected at random from a golf bag. If the golf bag contains 9 Titleists, 8 Maxflis, and 3 Top-Flites, find the probability of each event.
The golf ball is a Maxfli or Top-Flite.In Problem, a golf ball is selected at random from a golf bag. If the golf bag contains 9 Titleists, 8 Maxflis, and 3 Top-Flites, find the probability of each event.
The golf ball is a Titleist or Maxfli.In Problems, a golf ball is selected at random from a golf bag. If the golf bag contains 9 Titleists, 8 Maxflis, and 3 Top-Flites, find the probability of each event.
In Problem, find the probability of the indicated event if P(E) = 0.25 and P(F) = 0.45.If P(F) = 0.30, P(E or F) = 0.65, and P(E and F) = 0.15, find P(E).
In Problem, find the probability of the indicated event if P(E) = 0.25 and P(F) = 0.45.If P(E) = 0.60, P(E or F) = 0.85, and P(E and F) = 0.05, find P(F).
In Problems, find the probability of the indicated event if P(E) = 0.25 and P(F) = 0.45.Find P(Ec).
List the outcomes in F and H. Are F and H mutually exclusive?In Problem, a probability experiment is conducted in which the sample space of the experiment is S = {1, 2, 3, 4, 5, 6, 7, 8, 9, 10, 11, 12}. Let event E = {2, 3, 4, 5, 6, 7}, event F = {5, 6, 7, 8, 9}, event G = {9, 10, 11, 12}, and
List the outcomes in E and G. Are E and G mutually exclusive?In Problem, a probability experiment is conducted in which the sample space of the experiment is S = {1, 2, 3, 4, 5, 6, 7, 8, 9, 10, 11, 12}. Let event E = {2, 3, 4, 5, 6, 7}, event F = {5, 6, 7, 8, 9}, event G = {9, 10, 11, 12}, and
Showing 100 - 200
of 226
1
2
3
Step by Step Answers