

Question: Figure P3.4 shows a graph of position as a function of time for an object moving along a horizontal surface. At which of the labeled
Figure P3.4 shows a graph of position as a function of time for an object moving along a horizontal surface. At which of the labeled points is the object speeding up?
Data from Figure P3.4
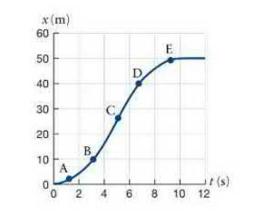
x (m) 60 50 40 30 20 10 0 T D E B A 0 2 4 6 8 10 12 t(s)
Step by Step Solution
★★★★★
3.59 Rating (152 Votes )
There are 3 Steps involved in it
1 Expert Approved Answer
Step: 1 Unlock

Question Has Been Solved by an Expert!
Get step-by-step solutions from verified subject matter experts
Step: 2 Unlock
Step: 3 Unlock