

Question: Why do the temperature versus heat curves in the solid, liquid, and gas regions of Figure 8.7 have different slopes? Figure 8.7 AHusion AHaporization Solid
Why do the temperature versus heat curves in the solid, liquid, and gas regions of Figure 8.7 have different slopes?
Figure 8.7
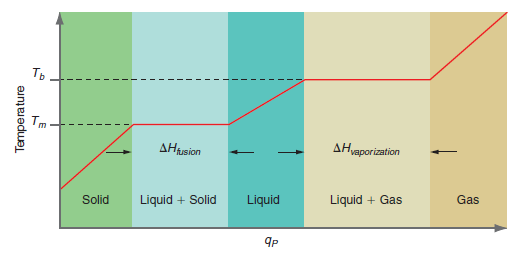
AHusion AHaporization Solid Liquid + Solid Liquid Liquid + Gas Gas Temperature
Step by Step Solution
★★★★★
3.40 Rating (156 Votes )
There are 3 Steps involved in it
1 Expert Approved Answer
Step: 1 Unlock

The slope of these curves are equal to the i... View full answer
Question Has Been Solved by an Expert!
Get step-by-step solutions from verified subject matter experts
Step: 2 Unlock
Step: 3 Unlock