

Question: Draw the snapshot graph D(x, t = 0 s) at t = 0 s for the wave shown in FIGURE EX16.6. D (cm) t (s)
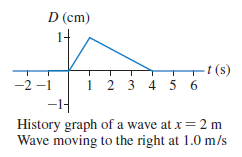
D (cm) t (s) 1 2 3 4 5 6 -1| -2 1 History graph of a wave at x = 2 m Wave moving to the right at 1.0 m/s
Step by Step Solution
★★★★★
3.33 Rating (162 Votes )
There are 3 Steps involved in it
1 Expert Approved Answer
Step: 1 Unlock

Model This is a wave traveling to the right at a constant ... View full answer
Question Has Been Solved by an Expert!
Get step-by-step solutions from verified subject matter experts
Step: 2 Unlock
Step: 3 Unlock