

FIGURE EX39.14 is a graph of |(x)| 2 for an electron. a. What is the value of
Question:
FIGURE EX39.14 is a graph of |ψ(x)|2for an electron.
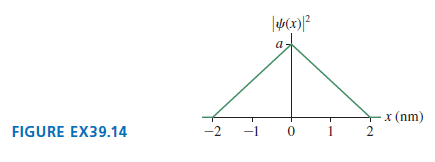 a. What is the value of a?b. Draw a graph of the wave function ψ(x). (There is more than one acceptable answer.)c. What is the probability that the electron is located between x = 1.0 nm and x = 2.0 nm
Fantastic news! We've Found the answer you've been seeking!
Step by Step Answer:
Model The probability of finding a particle is determined by the probabilit...View the full answer

Answered By
Muhammad Umair
I have done job as Embedded System Engineer for just four months but after it i have decided to open my own lab and to work on projects that i can launch my own product in market. I work on different softwares like Proteus, Mikroc to program Embedded Systems. My basic work is on Embedded Systems. I have skills in Autocad, Proteus, C++, C programming and i love to share these skills to other to enhance my knowledge too.
1+ Reviews
10+ Question Solved
Related Book For 

Physics for Scientists and Engineers A Strategic Approach with Modern Physics
ISBN: 978-0133942651
4th edition
Authors: Randall D. Knight
Question Posted:
