

Question: FIGURE EX9.20 is the force-versus-position graph for a particle moving along the x-axis. Determine the work done on the particle during each of the three
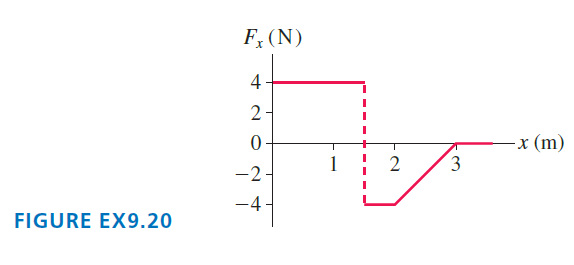
F, (N) 4 -x (m) 2 -2 - -4 FIGURE EX9.20
Step by Step Solution
★★★★★
3.47 Rating (170 Votes )
There are 3 Steps involved in it
1 Expert Approved Answer
Step: 1 Unlock

Model Use the definition of work Visualize Please refer t... View full answer
Question Has Been Solved by an Expert!
Get step-by-step solutions from verified subject matter experts
Step: 2 Unlock
Step: 3 Unlock
Document Format (2 attachments)
1442_6054778b5df0b_690570.pdf
180 KBs PDF File
1442_6054778b5df0b_690570.docx
120 KBs Word File