

Question: FIGURE P30.67 shows the potential difference across a 50 mH inductor. The current through the inductor at t = 0 s is 0.20 A. Draw
FIGURE P30.67 shows the potential difference across a 50 mH inductor. The current through the inductor at t = 0 s is 0.20 A. Draw a graph showing the current through the inductor from t = 0 s to t = 40 ms.
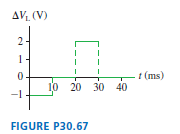
AV (V) 2 1 1 (ms) 10 20 30 40 FIGURE P30.67
Step by Step Solution
★★★★★
3.39 Rating (165 Votes )
There are 3 Steps involved in it
1 Expert Approved Answer
Step: 1 Unlock

Model Assume we can ignore the edges when the potential difference changes abruptly Visualize The ex... View full answer
Question Has Been Solved by an Expert!
Get step-by-step solutions from verified subject matter experts
Step: 2 Unlock
Step: 3 Unlock
Document Format (2 attachments)
1442_6054778bcc3b5_696261.pdf
180 KBs PDF File
1442_6054778bcc3b5_696261.docx
120 KBs Word File