

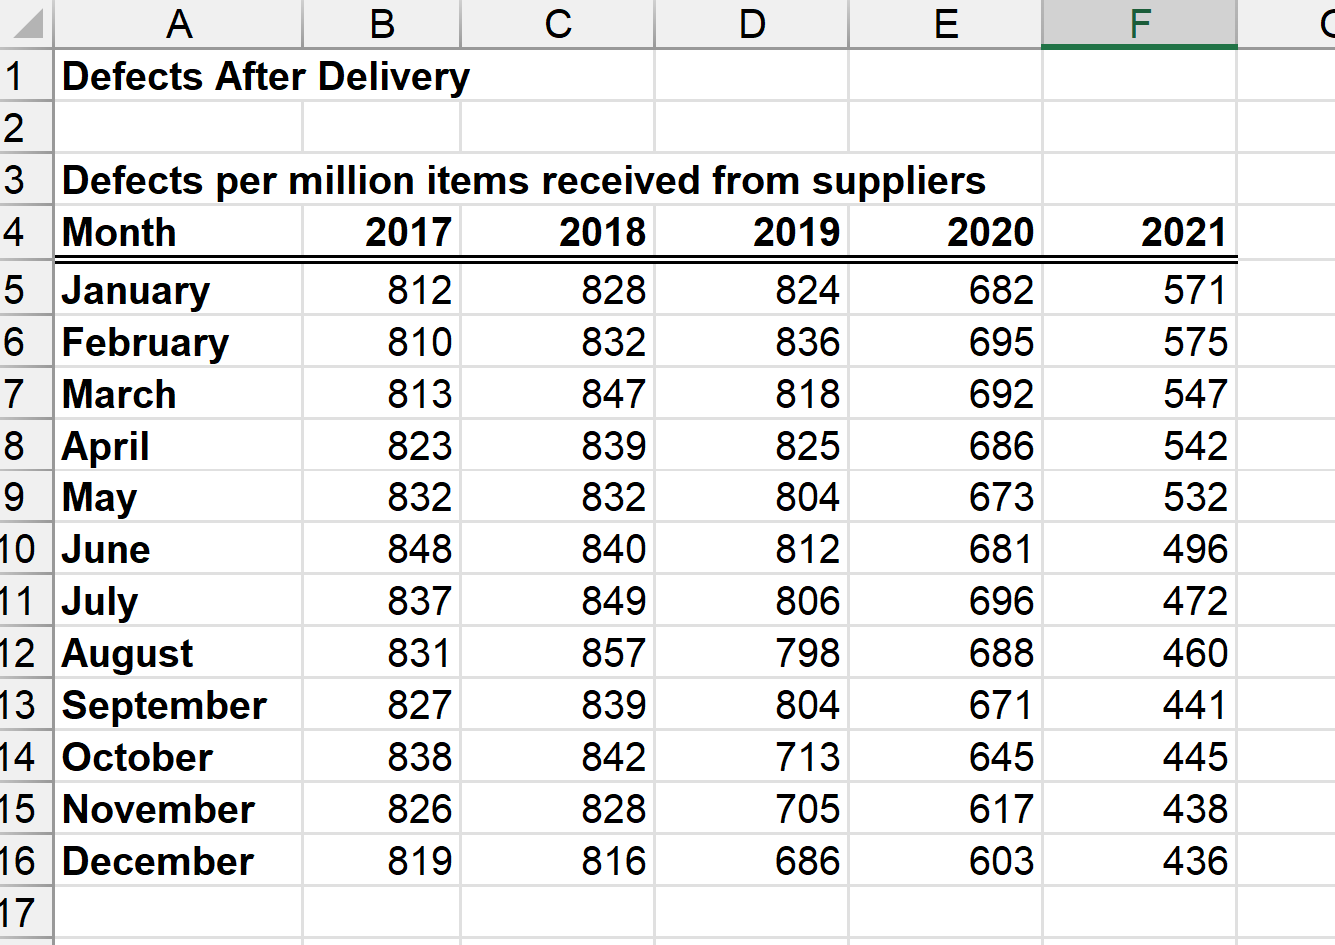
Question: 1. consider all defects data, from January 2017 through December 2021. Build a scatterplot of the defects over time. Fit a simple linear regression model
1. consider all defects data, from January 2017 through December 2021. Build a scatterplot of the defects over time. Fit a simple linear regression model to the data and a polynomial trendline of order 2. Which model is the best fit for the data? Simple Linear regression or polynomial trendline of order 2? Is the best fit model a good predictor of future defects?
2. When is the first month that we realized a clear drop in defects (Enter your answer as a month number)? Did that drop occur immediately after the supplier initiative was implemented in August 2018? Predict the number of defects for January 2022.
Please show work thank you
Step by Step Solution
There are 3 Steps involved in it
1 Expert Approved Answer
Step: 1 Unlock

Question Has Been Solved by an Expert!
Get step-by-step solutions from verified subject matter experts
Step: 2 Unlock
Step: 3 Unlock