

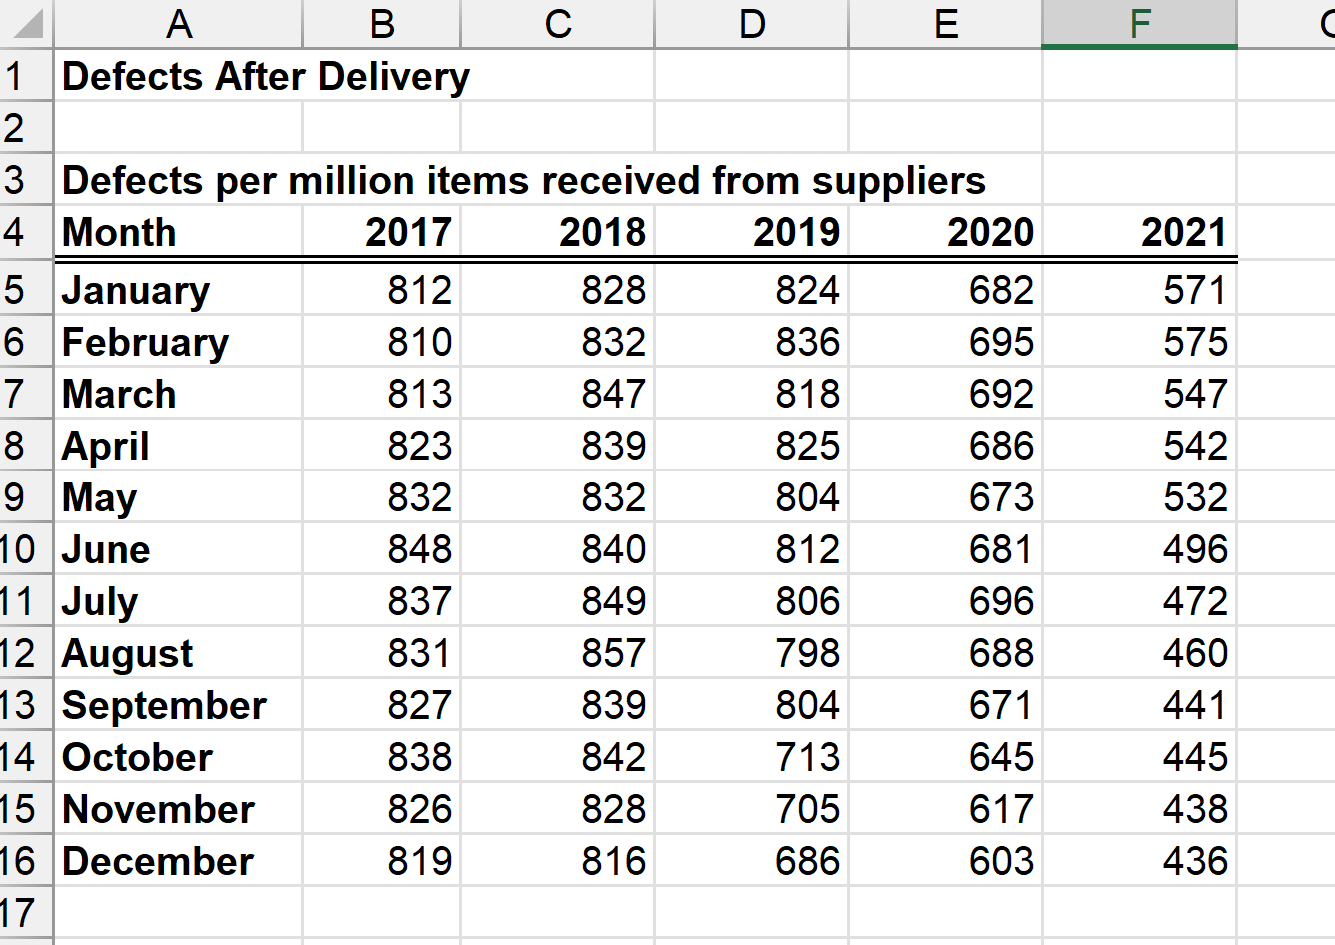
Question: 1. Consider the defects data from January 2017 through August 2018. Build a scatterplot of the defects over time. Fit (1) a simple linear regression
1. Consider the defects data from January 2017 through August 2018. Build a scatterplot of the defects over time. Fit (1) a simple linear regression model to the data, (2) a polynomial trendline of order 2, and (3) a polynomial trendline of order 3. Which model is the best fit for the data?
a) simple linear regression
b) polynomial trendline of order 2
c) polynomial trendline of order 3
2. Is the best fit model from question 1 a good predictor (at the time) of future defects? Yes or no?
3) Is linear regression an appropriate model to use for making a prediction of defects between January 2017 and August 2018?
4) Do the residuals in your linear regression model suggest any potential issues with the model?
a) Nonlinear patterns
b) Multicollinearity
c) Changing Variability
d) Correlated observations
e) Excluded variables
f) No problems with the regression residuals
Please show work. thank you
Step by Step Solution
There are 3 Steps involved in it

Get step-by-step solutions from verified subject matter experts