

Question: Now consider all defects data, from January 2017 through December 2021. Build a scatterplot of the defects over time. Fit a simple linear regression model
-
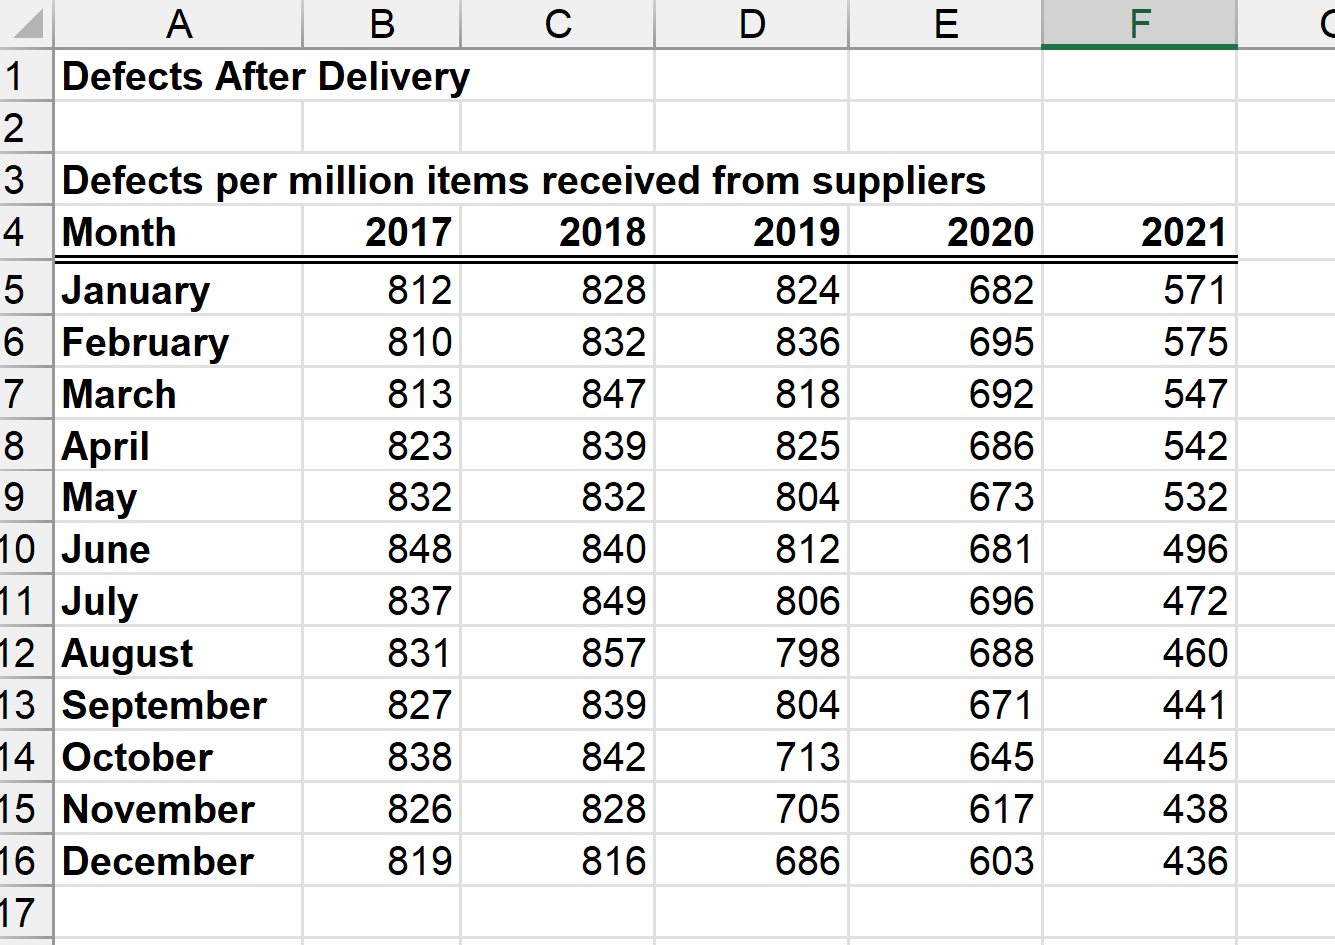
Now consider all defects data, from January 2017 through December 2021. Build a scatterplot of the defects over time. Fit a simple linear regression model to the data and a polynomial trendline of order 2. Which model is the best fit for the data?
simple linear regression
polynomial trendline of order 2
- Predict the number of defects for January 2022. Enter your solution as a whole number.
- When is the first month that realized a clear drop in defects?
-
Did that drop occur immediately after the supplier initiative was implemented in August 2018?
Yes
No
I am not sure
There is no drop in the data
Step by Step Solution
There are 3 Steps involved in it
1 Expert Approved Answer
Step: 1 Unlock

Question Has Been Solved by an Expert!
Get step-by-step solutions from verified subject matter experts
Step: 2 Unlock
Step: 3 Unlock