

Question: 1. consider all defects data, from January 2017 through December 2021. Build a scatterplot of the defects over time. Fit a simple linear regression model
1. consider all defects data, from January 2017 through December 2021. Build a scatterplot of the defects over time. Fit a simple linear regression model to the data and a polynomial trendline of order 2. Which model is the best fit for the data?
a) Simple Linear Regression
b) polynomial trendline of order 2 (my answer)
2. Is the best fit model from question 6 a good predictor of future defects? Yes or No? ( I answered yes)
3. When is the first month that PLE realized a clear drop in defects? Enter your answer as a month number ( I answered October =10 )
4. Did that drop occur immediately after the supplier initiative was implemented in August 2018?
a) yes
b) no ( my answer)
c) I don't know
d) there is no drop in the data
5. Predict the number of defects for January 2022. Enter your solution as a whole number; example: 42. ( my answer: -409835 ( I know this is not right))
Please help me, I don't understand what I'm doing wrong. can someone please explain how to get the right answer? Will thumbs up for a good answer! Thank you!
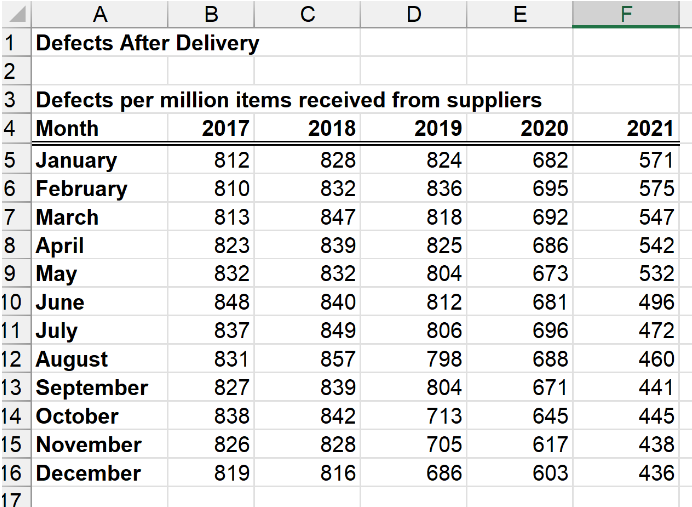
F A B D E 1 Defects After Delivery 2 3 Defects per million items received from suppliers 4 Month 2017 2018 2019 2020 5 January 812 828 824 682 6 February 810 832 836 695 7 March 813 847 818 692 8 April 823 839 825 686 9 May 832 832 804 673 10 June 848 840 812 681 11 July 837 849 806 696 12 August 831 857 798 688 13 September 827 839 804 671 14 October 838 842 713 645 15 November 826 828 705 617 16 December 819 816 686 603 17 2021 571 575 547 542 532 496 472 460 441 445 438 436
Step by Step Solution
There are 3 Steps involved in it

Get step-by-step solutions from verified subject matter experts