

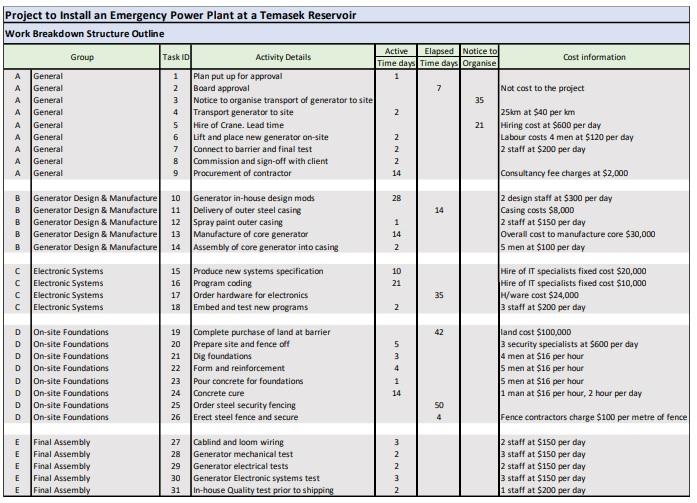
Question: 1. Construct a suitable network diagram which shows the precedence logic of each activity. You should use the activity-on-arrow or precedence method. Use the diagram
1. Construct a suitable network diagram which shows the precedence logic of each activity. You should use the activity-on-arrow or precedence method. Use the diagram to calculate each activity. Early start Date number and hence determine the earliest likely overall completion time. Taking this day number as a target for completion, calculate the Latest Times for each activity or node. Finally, calculate the floats and show the critical path.
2. From your network information using an Excel spreadsheet to one-day accuracy, produce a Gantt chart based on Early started times. Explain the limitations of the Gantt chart on its own and how an activity network assisted by computer software could be used to monitor the actual progress in terms of timing throughout the project and what steps might be taken to improve the timing schedule if the project were required to be completed in two months.
3. Using the given cost estimate information, calculate total cost by Group and Overall, without and then with Contingency. Construct a budget (BCWS) spreadsheet with activities down the left-hand side and a month-by-month calendar as the X-Axis. Apply a suitable method of allocating the cost of each activity evenly over each month of its duration. Allocate costs to months. The sheet should show sub-total costs for each activity group and overall per month. Construct a graph against time for the periodic spend and the same information on a cumulative basis.
Step by Step Solution
There are 3 Steps involved in it

Get step-by-step solutions from verified subject matter experts